About the Great East Japan Earthquake
1. Overview of Damage
-
Name of earthquake
-
2011 off the Pacific coast of Tohoku Earthquake (later renamed: Great East Japan Earthquake)
-
Date and time
-
Friday, March 11, 2011, 2:46 pm
-
Epicenter
-
Off the coast of Sanriku (latitude 38.1 degrees north, longitude 142.5 degrees east), around 130 km east of Oshika Peninsula, at a depth of 24 km
-
Maximum seismic intensity
-
Intensity 7 at Kurihara City in northern Miyagi Prefecture
-
Scale
-
Magnitude 9.0
-
Human casualties
-
10,568 dead and 1,215 missing (as of Sept. 30, 2022)
Note: Equivalent to about half of the total number of casualties including other prefectures
-
Peak of evacuation within Miyagi Prefecture
-
Evacuation centers: 1,323 facilities (as of March 15, 2011)
Number of evacuees: 320,885 (as of March 14, 2011) -
Residential damage
-
Residences completely destroyed: 83,005; residences damaged: 155,130 (as of Sept. 30, 2022)
Note: Equivalent to about 60% of the total damage including other prefectures
-
Damage to essential utilities (at the peak of the disaster in Miyagi Prefecture)
-
Electricity cut off to 1,545,494 homes; water supply cut off in 35 cities and towns; gas cut off to 13 cities and towns
Note: All utilities within the prefecture were restored by December 11, 2011
-
Land area flooded
-
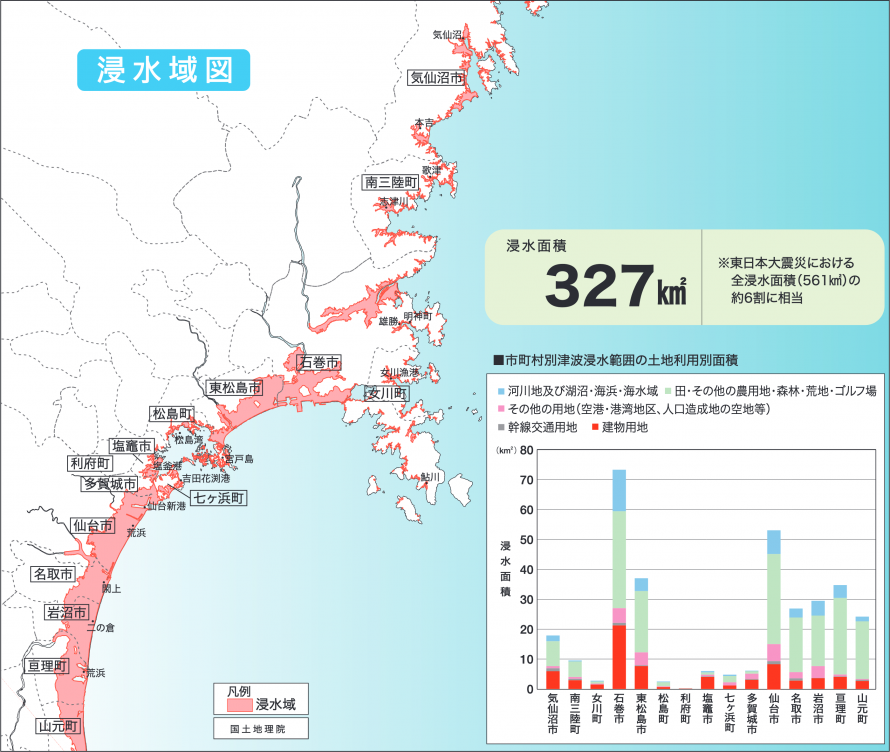
327 km2
Note: Equivalent to about 60% of the total flooded land area of 561 km2 in six prefectures (Aomori, Iwate, Miyagi, Fukushima, Ibaraki, Chiba) -
Land subsidence
-
Land area below sea level: 56 km2
-
Amount of damage (survey completed)
-
9,096.8 billion yen (as of Sept. 2021)
Digest Video
Warning: This video contains images of destruction by a tsunami.
2. Overview of the Great East Japan Earthquake
(1) A magnitude 9.0 earthquake strikes, one of the largest in Japan’s recorded history
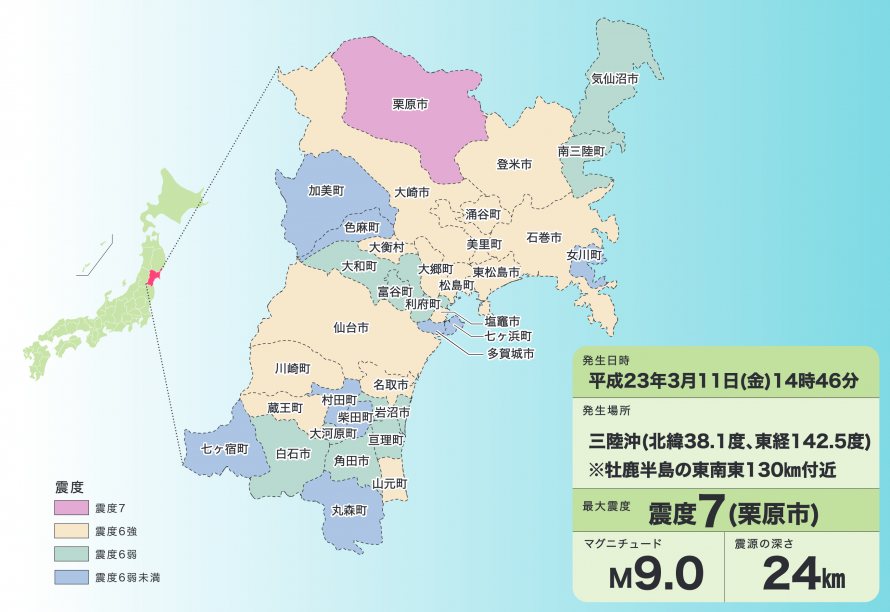
At 2:46 p.m. on March 11, 2011, a massive magnitude-9.0 earthquake occurred off the Sanriku coast. Its epicenter was geographically located at 38°06.2'N, 142°51.6'E at a depth 24 km. Tremors were felt throughout the Japanese archipelago on a seismic intensity scale of 1 to 6 lower, but the greatest intensity was felt in eastern Japan. A maximum seismic intensity of 7 was recorded in Kurihara City, Miyagi Prefecture. (See Figure 1)
The Japan Meteorological Agency named the earthquake the “2011 off the Pacific coast of Tohoku Earthquake,” and because of the damage it caused, the Japanese government later renamed it the “Great East Japan Earthquake.”
Figure 1: Seismic Intensity by Municipality within the Prefecture
(2) The largest tsunami in Japan’s recorded history
The first tsunami wave crashed ashore about 30 minutes after the earthquake.
A massive tsunami was recorded at the tide gauge station in Ofunato City, Iwate Prefecture, which reached over 8.0 meters in height, followed by another at Ayukawa in Ishinomaki City, Miyagi Prefecture at over 8.6 meters. Data records were lost at many stations, but it is estimated that the subsequent tsunamis were much bigger. The run-up height, which is the maximum vertical height above sea level that the tsunami wave reaches at any point on land, also gives an idea of its scale. (See Table 1 and Figure 2).
The tsunami flowed up the river from the ocean and reached inland areas even very far from the coastline, causing immense damage. Miyagi Prefecture, which has a large percentage of low-lying land area, suffered far more land inundation than any other prefecture at 327 km2(see Figure 3), approximately 60% of the total.
Table 1: Land area flooded by the tsunami and watermark heights in the prefecture
| No. | Former municipality | Current municipality | Area | Area of merged municipality | Maximum inundation height (T.P.) | Maximum run-up height (T.P.) |
|---|---|---|---|---|---|---|
| 1 | Karakuwa Town | Kesennuma City | 129ha | 1,833ha | 15.2m | 21.1m |
| 2 | Kesennuma City | 1,087ha | 16.6m | 17.3m | ||
| 3 | Motoyoshi-cho | 617ha | 19.3m | 22.3m | ||
| 4 | Utatsu Town | Minamisanriku Town | 310ha | 978ha | 18.1m | 26.1m |
| 5 | Shizugawa Town | 668ha | 19.6m | 20.2m | ||
| 6 | Kitakami Town | Ishinomaki City | 974ha | 7,700ha | 14.4m | 17.8m |
| 7 | Ogatsu Town | 152ha | 16.2m | 21.0m | ||
| 8 | Kahoku Town | 1,942ha | 5.0m | 8.8m | ||
| 9 | Kanan Town | 446ha | 2.6m | --m | ||
| 10 | Ishinomaki City | 3,960ha | 11.5m | 12.0m | ||
| 11 | Oshika Town | 227ha | 17.5m | 26.0m | ||
| 12 | Onagawa Town | Onagawa Town | 293ha | 18.5m | 34.7m | |
| 13 | Yamoto Town | Higashi-Matsushima City | 2,222ha | 3,771ha | 7.6m | --m |
| 14 | Naruse Town | 1,549ha | 10.1m | --m | ||
| 15 | Matsushima Town | Matsushima Town | 157ha | 2.8m | --m | |
| 16 | Rifu Town | Rifu Town | 14ha | 6.3m | --m | |
| 17 | Shiogama City | Shiogama City | 433ha | 4.8m | --m | |
| 18 | Shichigahama Town | Shichigahama Town | 520ha | 11.6m | --m | |
| 19 | Tagajo City | Tagajo City | 623ha | 5.5m | --m | |
| 20 | Sendai City Miyagino Ward | Sendai City Miyagino Ward | 2,092ha | 13.9m | --m | |
| 21 | Sendai City Wakabayashi Ward | Sendai City Wakabayashi Ward | 2,775ha | 11.9m | --m | |
| 22 | Sendai City Taihaku Ward | Sendai City Taihaku Ward | 110ha | 2.1m | --m | |
| 23 | Natori City | Natori City | 2,740ha | 11.8m | --m | |
| 24 | Iwanuma City | Iwanuma City | 2,828ha | 10.5m | --m | |
| 25 | Watari Town | Watari Town | 3,493ha | 8.1m | --m | |
| 26 | Yamamoto Town | Yamamoto Town | 2,441ha | 14.6m | 10.4m | |
| Total | 32,801ha | |||||
Note: Land area is shown both by former and merged municipality.
Note: Watermark height (trace height) is separated into maximum inundation height and maximum run-up height. The further a tsunami reaches inland on flat ground, the lower the tsunami height but the greater the inundation height, so the run-up height is not shown for flatland areas.
Source: The Great East Japan Disaster Response in Miyagi Prefecture in the First Year Following the Earthquake and Tsunami
Figure 2: Relationship between tsunami height at a tide gauge station and flow depth, watermark height, and run-up height
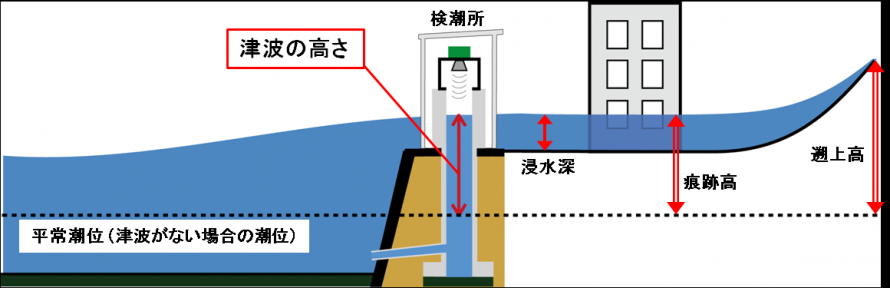
Source: Meteorological Agency website “Tsunami ni tsuite” (in Japanese)
https://www.jma.go.jp/jma/kishou/know/faq/faq26.html
Figure 3: Inundated area in the prefecture
(3) Human casualties and residential damage
The Great East Japan Earthquake claimed a huge number of lives. The totals for all affected prefectures were 19,759 dead and 2,553 missing. Miyagi Prefecture alone lost 10,569 people, the highest toll of any prefecture, accounting for over 50% of the total human loss. The search continues for the 1,215 missing in the prefecture, as well. (See Table 2.) About 90% of deaths were caused by drowning (see Graph 1), with a large number likely due to hypothermia in the freezing cold water. The figures for residential damage in the prefecture were 83,005 houses completely destroyed and 155,130 houses damaged, accounting for approximately 60% of the total number of dwellings damaged in all areas affected by the earthquake and tsunami.
Note: Nationwide human casualties and damage to residential properties: current as of March 1, 2022 (Fire and Disaster Management Agency Great East Japan Earthquake Report 162); Miyagi Prefecture human casualties and damage to residential properties: current as of September 30, 2022 (from figures published by the Miyagi Prefecture Reconstruction and Crisis Management Division, General Affairs Department)"
Table 2: Human casualties and residential damage
| Municipality | Human casualties | Residential damage | |||||
|---|---|---|---|---|---|---|---|
| Population | Deaths | Missing | Completely destroyed (including inundation above floor level) | Damaged (including inundation above floor level) | |||
| [National census] | Direct deaths | Related deaths | Total | ||||
| (2010.10) | Houses | Houses | |||||
| Sendai City | 1,045,986 | 658 | 265 | 923 | 27 | 30,034 | 109,609 |
| Ishinomaki City | 160,826 | 3,277 | 276 | 3,553 | 417 | 20,044 | 13,049 |
| Shiogama City | 56,490 | 24 | 18 | 42 | 0 | 672 | 3,278 |
| Kesennuma City | 73,489 | 1,109 | 110 | 1,219 | 214 | 8,483 | 2,571 |
| Shiroishi City | 37,422 | 0 | 1 | 1 | 0 | 40 | 566 |
| Natori City | 73,134 | 912 | 42 | 954 | 38 | 2,801 | 1,129 |
| Kakuda City | 31,336 | 0 | 0 | 0 | 0 | 13 | 158 |
| Tagajo City | 63,060 | 188 | 31 | 219 | 0 | 1,746 | 3,730 |
| Iwanuma City | 44,187 | 180 | 6 | 186 | 1 | 736 | 1,606 |
| Tome City | 83,969 | 0 | 10 | 10 | 3 | 201 | 1,801 |
| Kurihara City | 74,932 | 0 | 1 | 1 | 0 | 58 | 372 |
| Higashi-Matsushima City | 42,903 | 1,067 | 66 | 1,133 | 22 | 5,519 | 5,558 |
| Osaki City | 135,147 | 2 | 5 | 7 | 0 | 596 | 2,434 |
| Tomiya City | 47,042 | 0 | 1 | 1 | 0 | 16 | 537 |
| Zao Town | 12,882 | 0 | 0 | 0 | 0 | 16 | 156 |
| Shichikashuku Town | 1,694 | 0 | 0 | 0 | 0 | 0 | 0 |
| Ogawara Town | 23,530 | 0 | 2 | 2 | 0 | 10 | 148 |
| Murata Town | 11,995 | 0 | 1 | 1 | 0 | 9 | 116 |
| Shibata Town | 39,341 | 2 | 3 | 5 | 0 | 13 | 189 |
| Kawasaki Town | 9,978 | 0 | 0 | 0 | 0 | 0 | 14 |
| Marumori Town | 15,501 | 0 | 0 | 0 | 0 | 1 | 38 |
| Watari Town | 34,845 | 265 | 18 | 283 | 4 | 2,389 | 1,150 |
| Yamamoto Town | 16,704 | 681 | 20 | 701 | 17 | 2,217 | 1,085 |
| Matsushima Town | 15,085 | 2 | 5 | 7 | 0 | 221 | 1,785 |
| Shichigahama Town | 20,416 | 76 | 3 | 79 | 2 | 674 | 650 |
| Rifu Town | 33,994 | 1 | 1 | 2 | 0 | 56 | 901 |
| Taiwa Town | 24,894 | 0 | 1 | 1 | 1 | 42 | 268 |
| Osato Town | 8,927 | 1 | 0 | 1 | 0 | 50 | 274 |
| Ohira Village | 5,334 | 0 | 0 | 0 | 0 | 0 | 19 |
| Shikama Town | 7,431 | 0 | 0 | 0 | 0 | 0 | 15 |
| Kami Town | 25,527 | 0 | 0 | 0 | 0 | 8 | 35 |
| Wakuya Town | 17,494 | 1 | 0 | 1 | 1 | 144 | 735 |
| Misato Town | 25,190 | 0 | 2 | 2 | 0 | 129 | 627 |
| Onagawa Town | 10,051 | 593 | 22 | 615 | 257 | 2,924 | 349 |
| Minamisanriku Town | 17,429 | 600 | 20 | 620 | 211 | 3,143 | 178 |
| Totals | 2,348,165 | 9,639 | 930 | 10,569 | 1,215 | 83,005 | 155,130 |
Note 1: The above figures include damage from aftershocks in 2011 on April 7, July 25, July 31, August 19, October 10, and in 2012 on August 30 and December 7, but do not include damage from aftershocks from the 2016 Fukushima earthquake on November 22, 2016.
Note 2: Deaths
• Direct deaths: Total number of deaths caused by the tsunami or house collapse, etc., confirmed in each municipality
• Related deaths: Total number of deaths caused indirectly by the disaster and confirmed by a Condolence Money Provision Review Board or other body
Graph 1: Deaths caused by the Great East Japan Earthquake
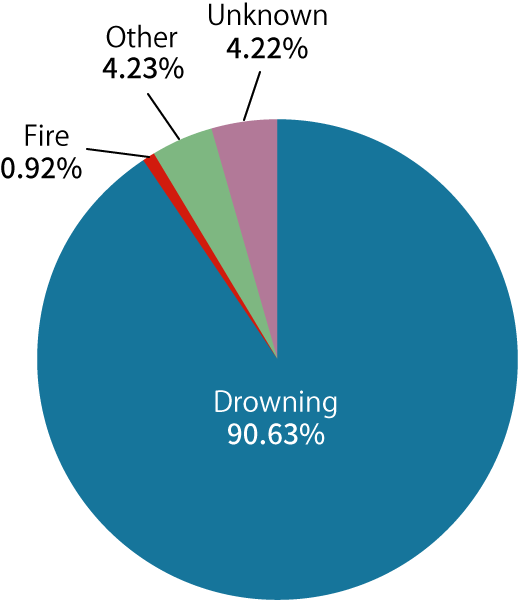
(As of March 11, 2012: 2012 White Paper On Police, National Police Agency)
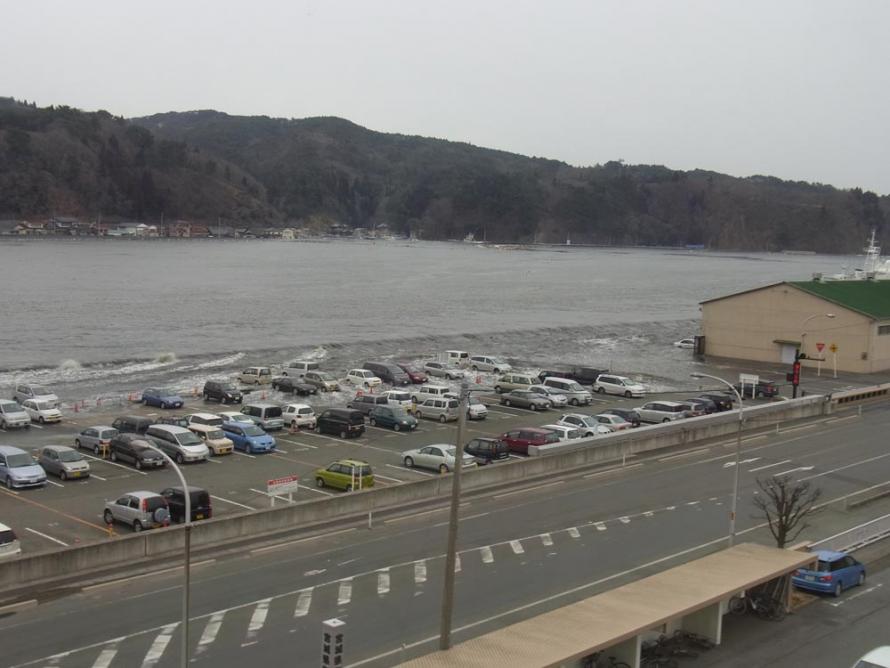
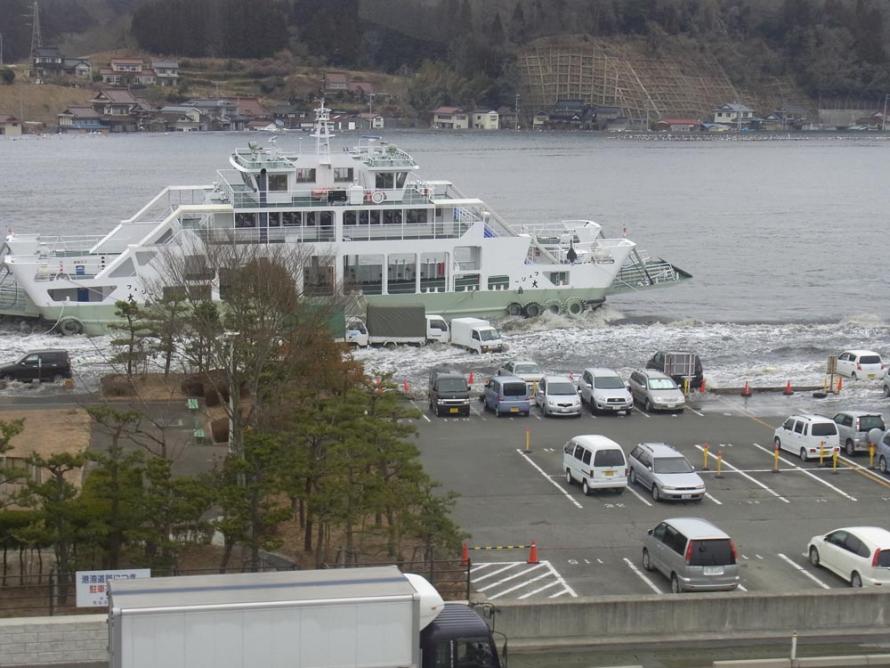
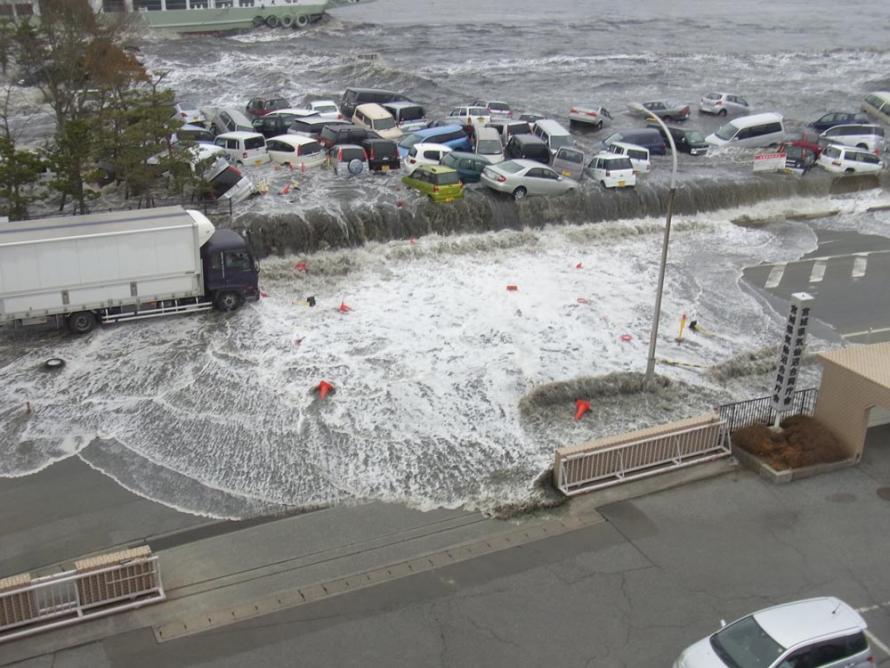
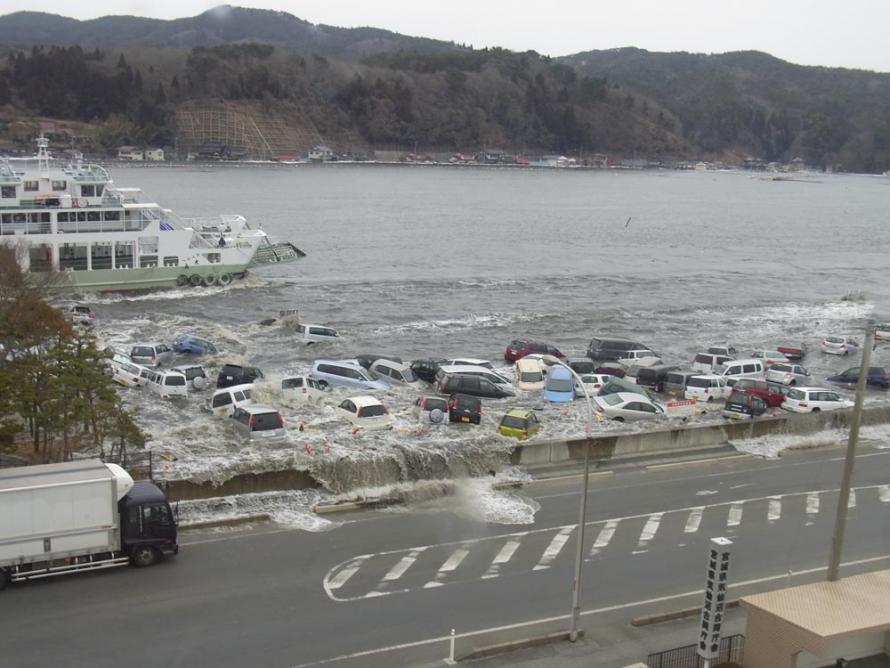
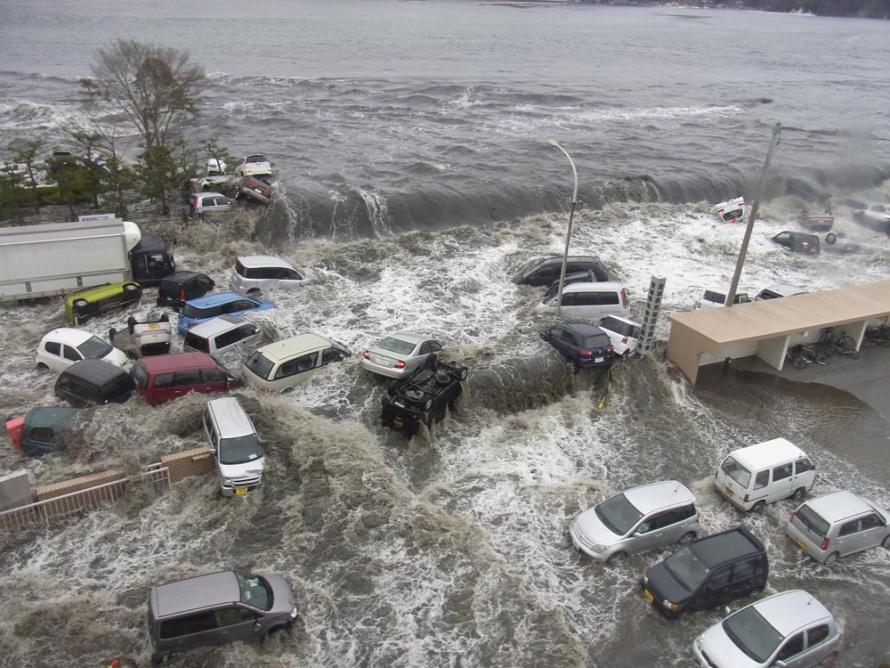
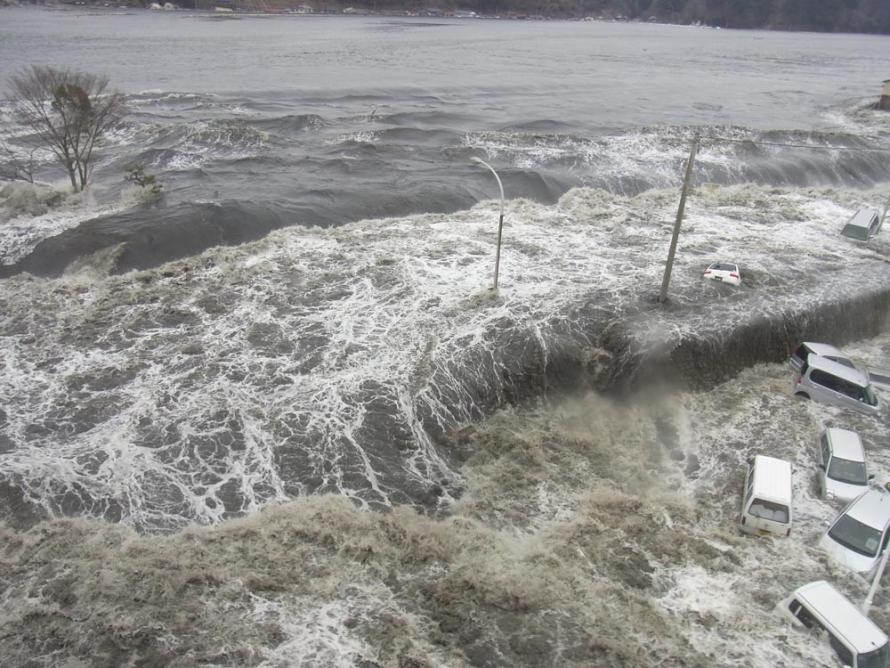
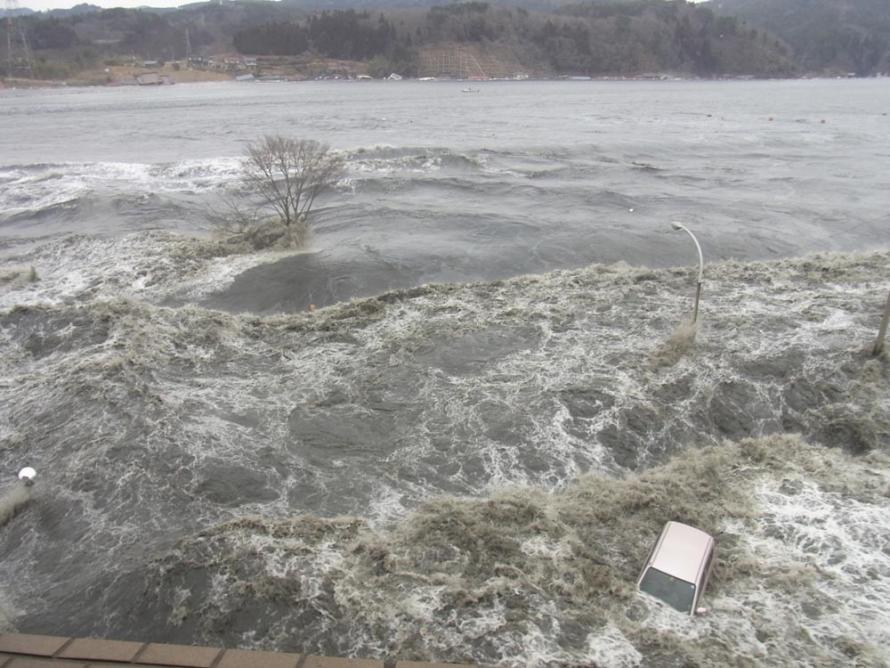
3. Scenes of the Disaster
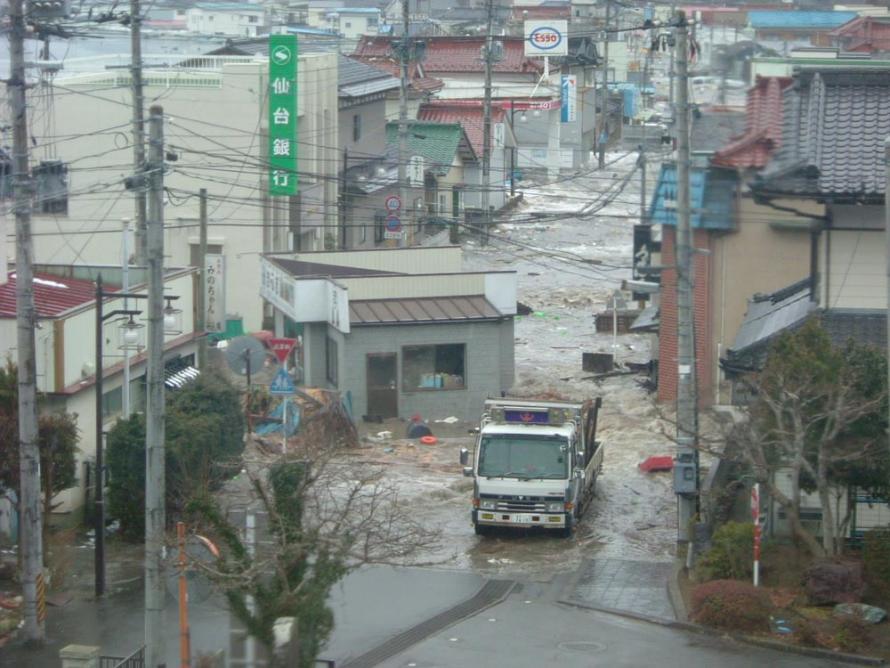
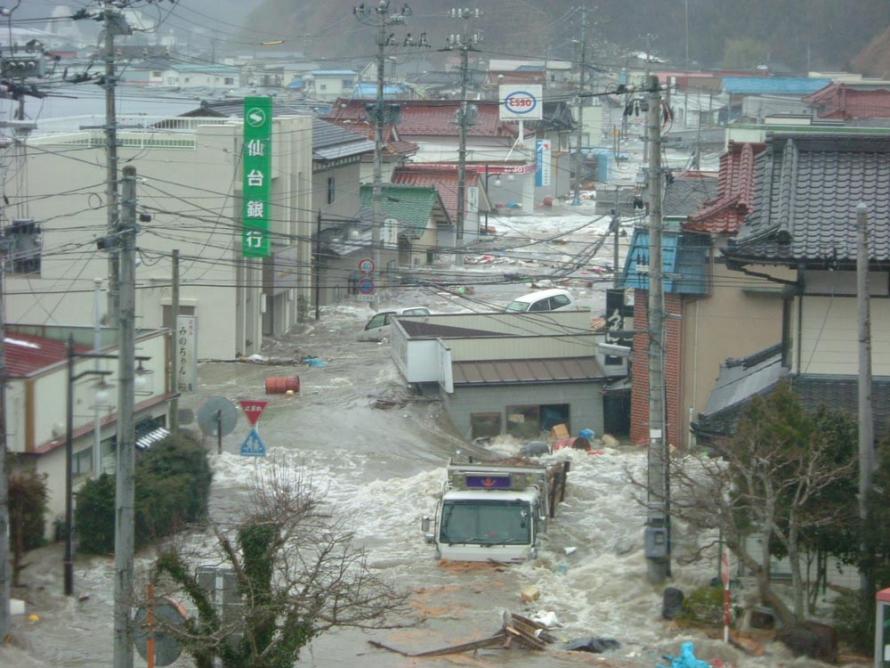
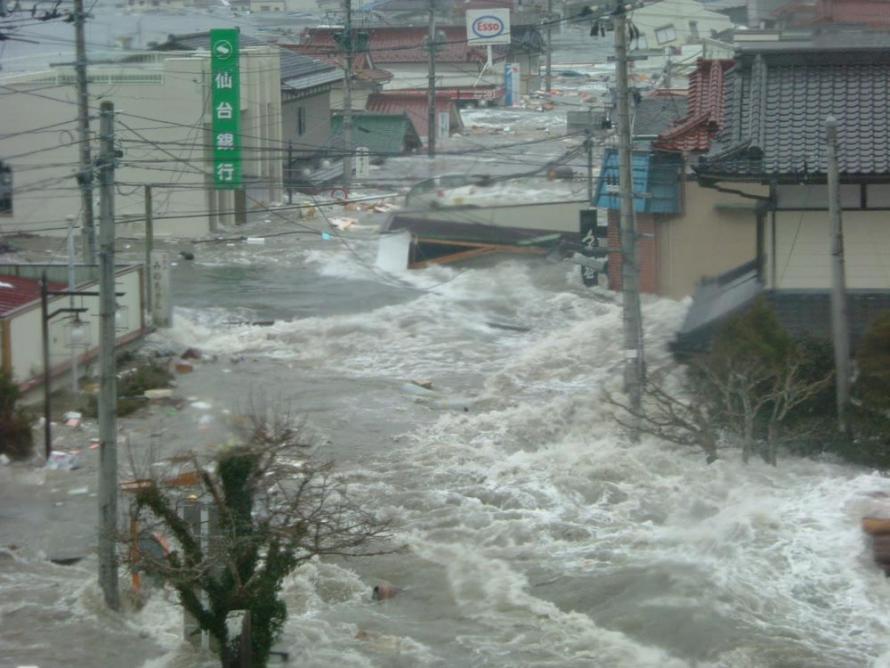
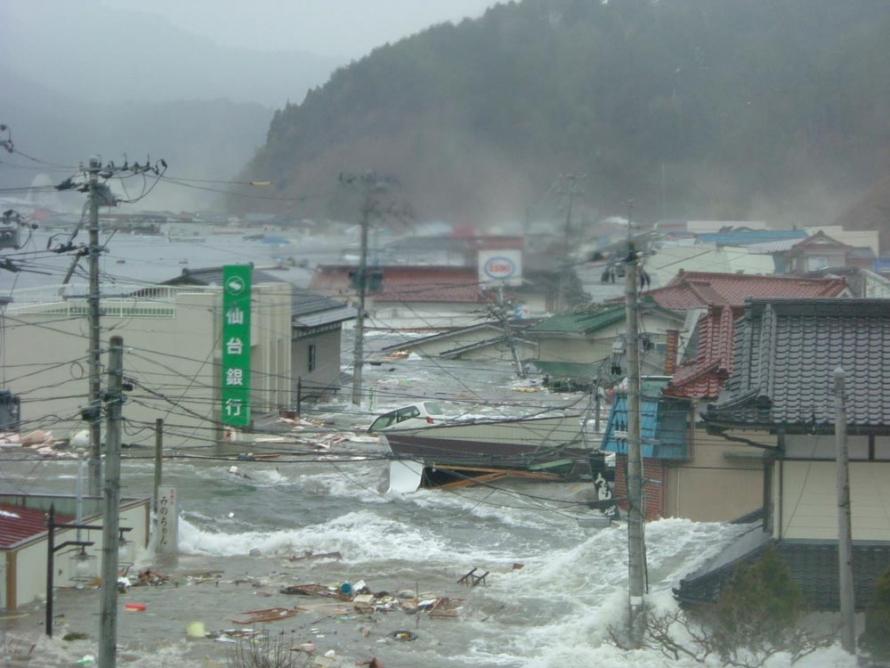
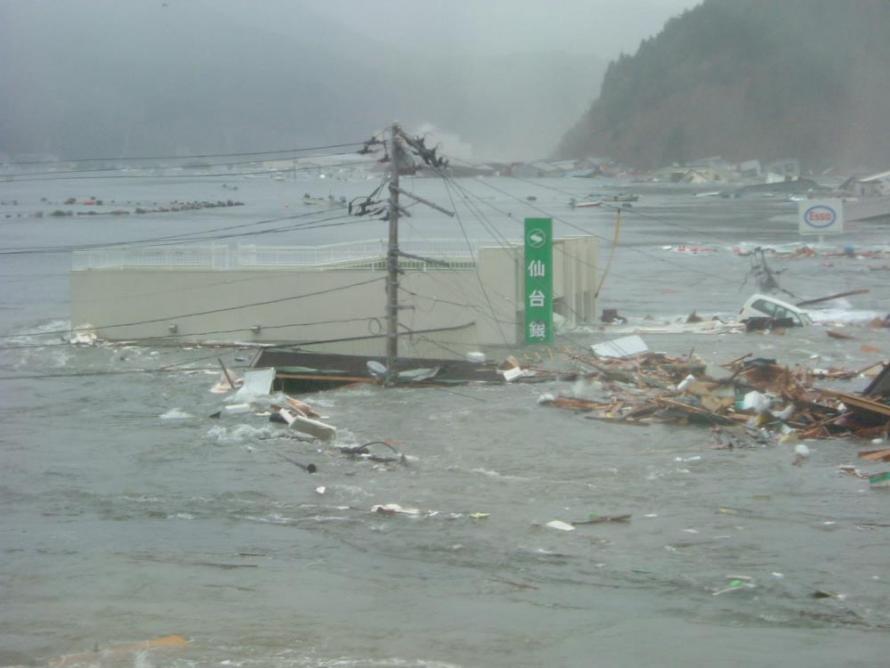
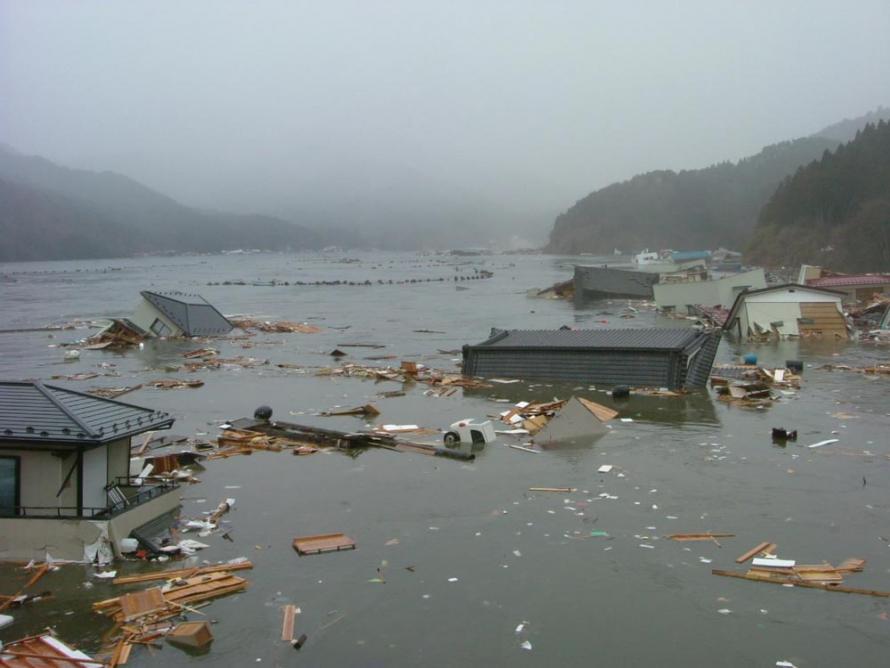
(1) Inundation by the Tsunami
The photos below show the tsunami flooding in time sequences. The time stamps show how incredibly quickly the water level rose.
1. Asahi-cho, Kesennuma City (time series)
15:28 (1)
15:28 (2)
15:28 (3)
15:28 (4)
15:29 (1)
15:29 (2)
15:30
2. Isehata area, Ogatsu-cho, Ishinomaki City (time series)
15:23 (1)
15:23 (2)
15:24
15:25 (1)
15:25 (2)
15:26
15:28
March 12, 6:11 a.m.
3. Tsunami swallows Minamihama area, Ishinomaki City (video from private citizen)
This video was taken from atop a building (near the former Ishinomaki Gas company) standing about 500 meters from the ocean.
Warning: This video contains images of destruction by a tsunami.
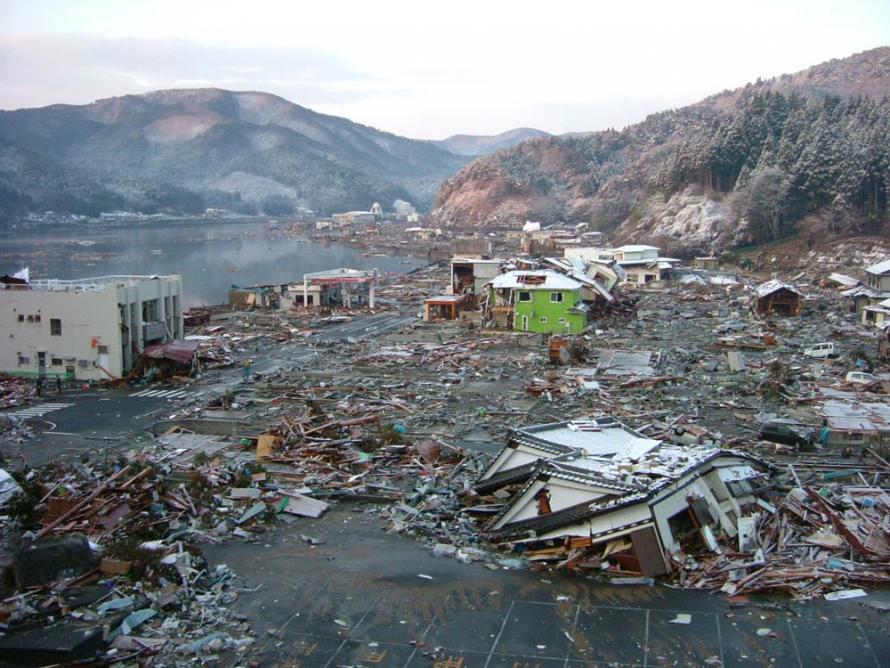
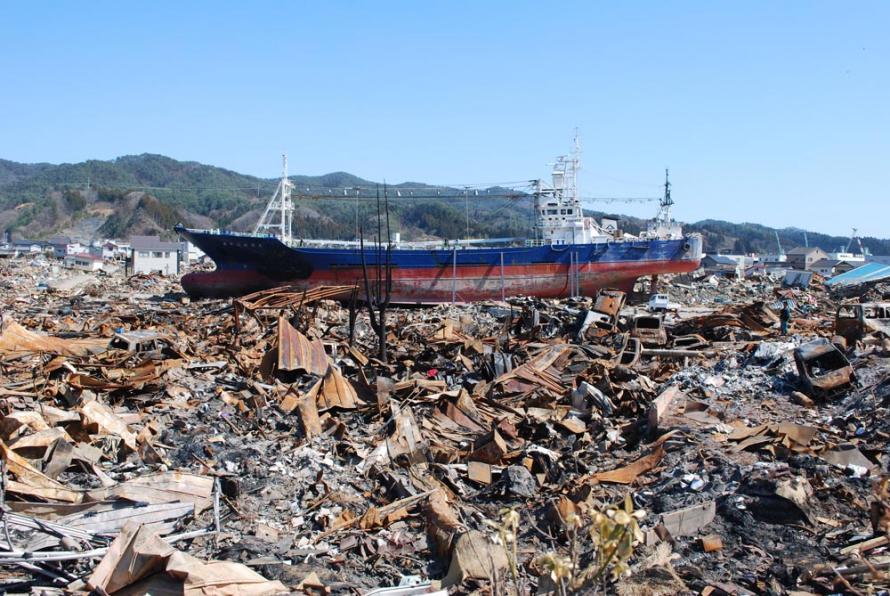
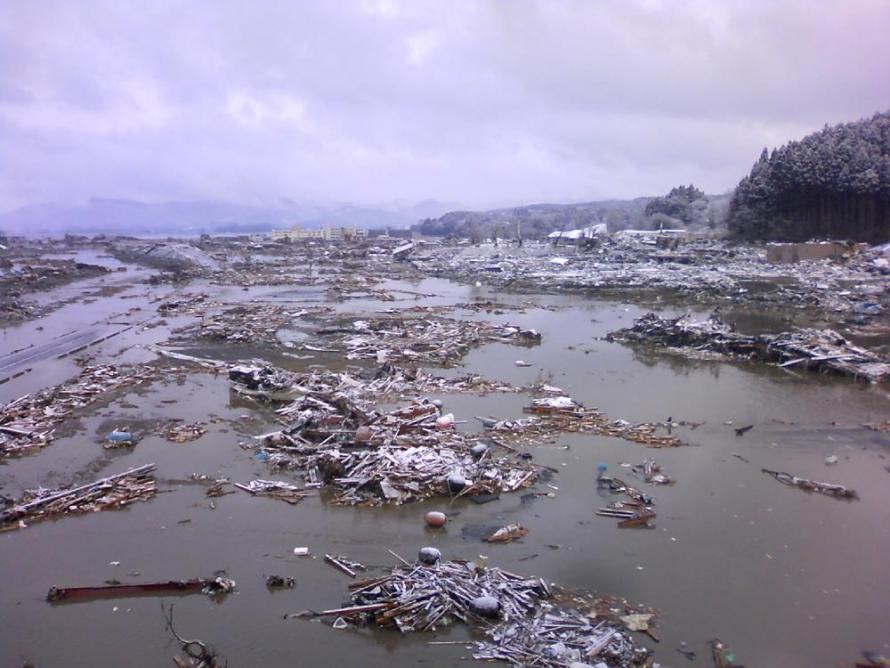
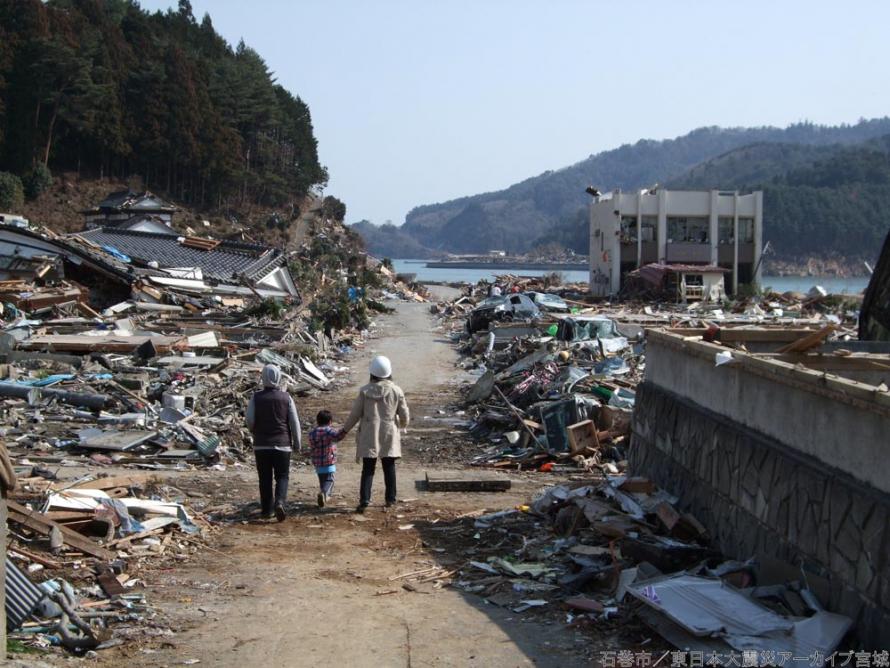
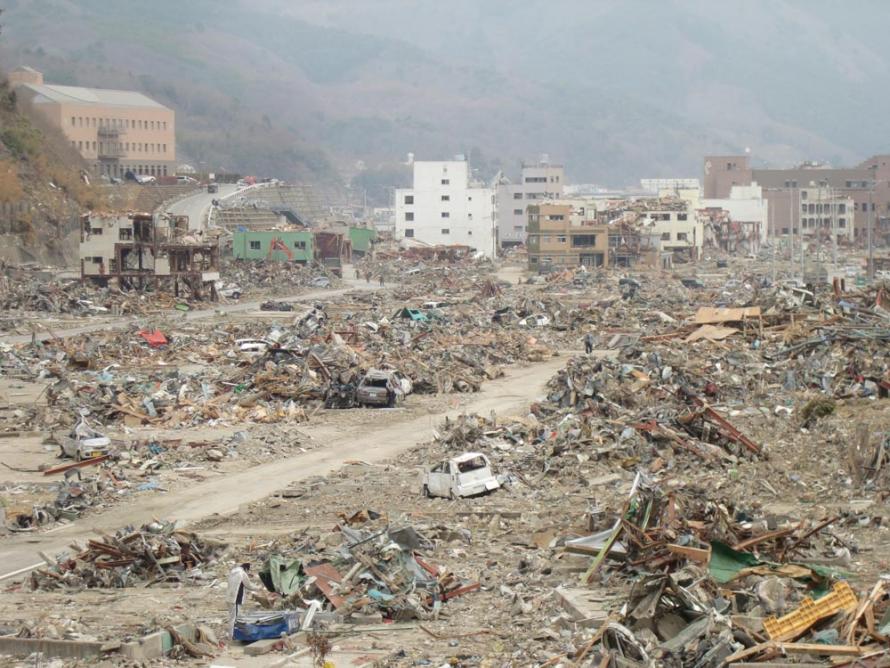
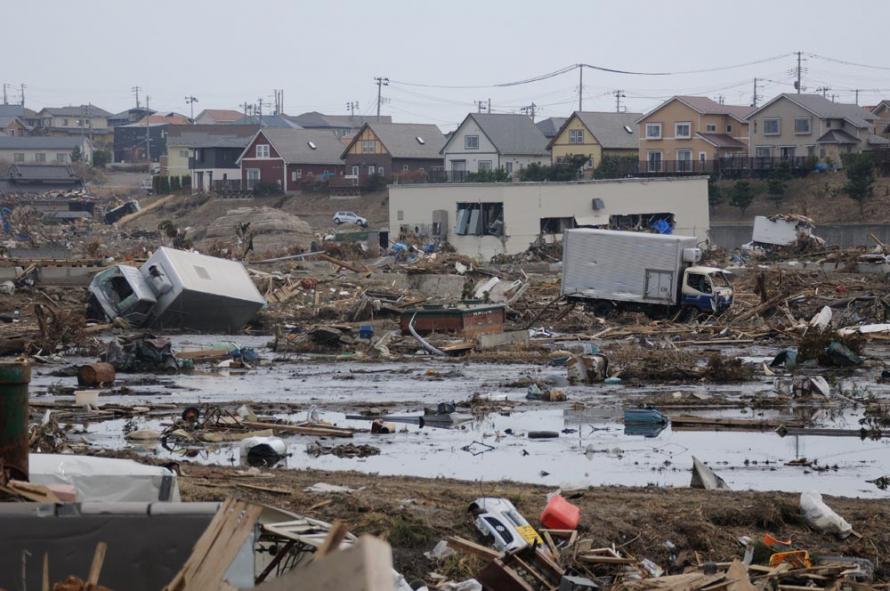
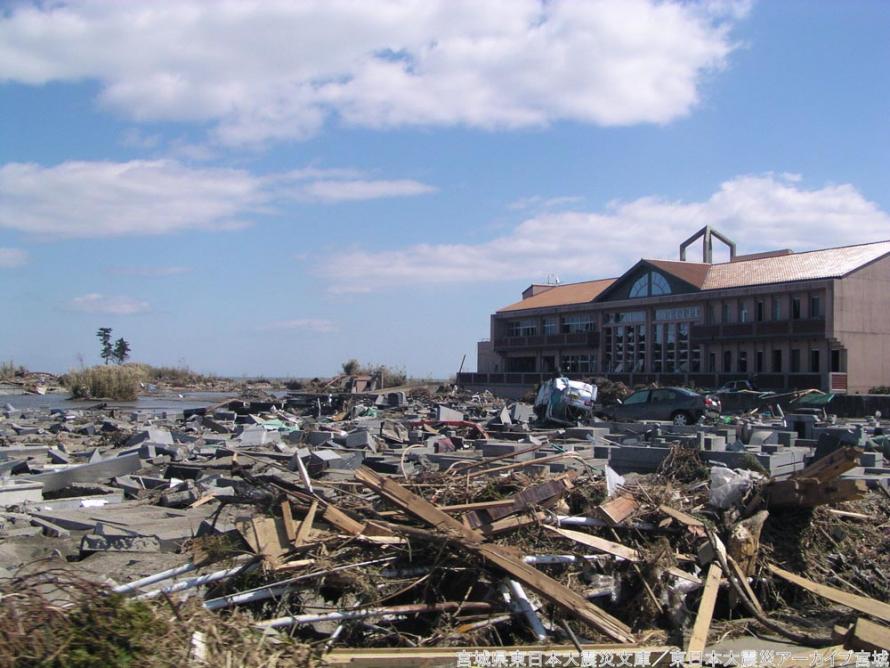
(2) Images of Destruction by Area
The massive tsunami that hit the coastal areas completely destroyed towns in a flash, taking everything from residents and ruining their lives. Further inland, livelihoods were also significantly disrupted. Homes were damaged, residential land collapsed, schools and commercial buildings were damaged, roads and public transportation networks were severed, and power supply was cut off.
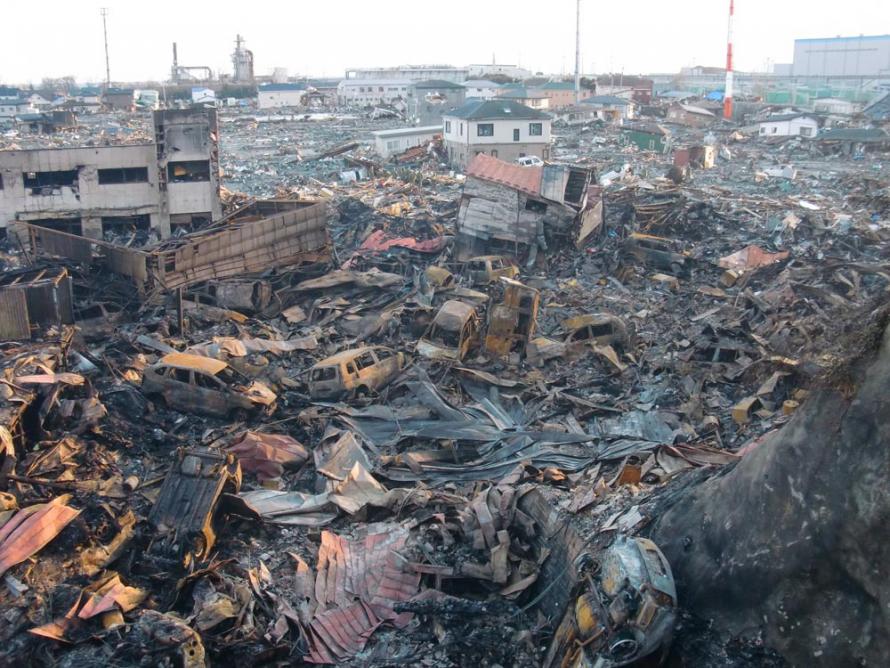
1. Kesennuma and Minamisanriku Areas
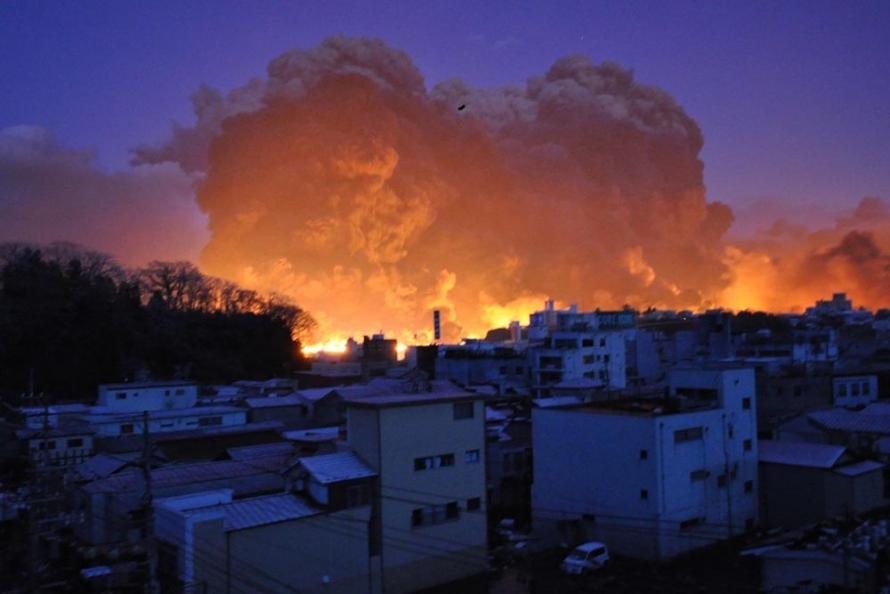
Kesennuma City: Fire
Kesennuma City: Nishi Minato, Kesennuma
Minamisanriku Town: soon after the tsunami hit (photo taken on March 11, 2011, from the rooftop of the Minamisanriku government office building)
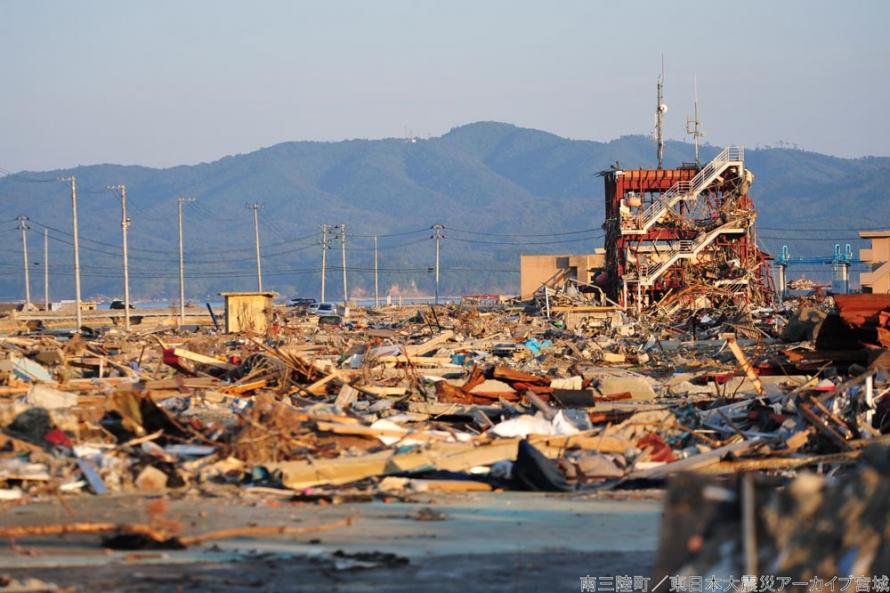
Minamisanriku Town: Former government disaster prevention agency building
2. Ishinomaki Area
Ishinomaki City: Kadonowaki-cho
Ishinomaki City: looking out to the sea from in front of the Ogatsu General Branch Office
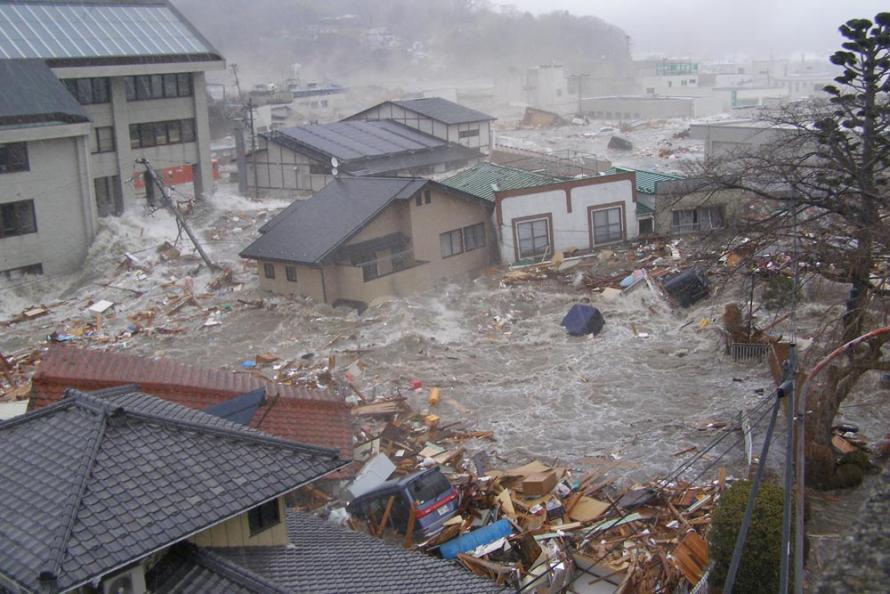
Onagawa Town: Tsunami as it was striking
Onagawa Town: Kogane, Onagawa-cho strewn with debris (photo taken April 11, 2011)
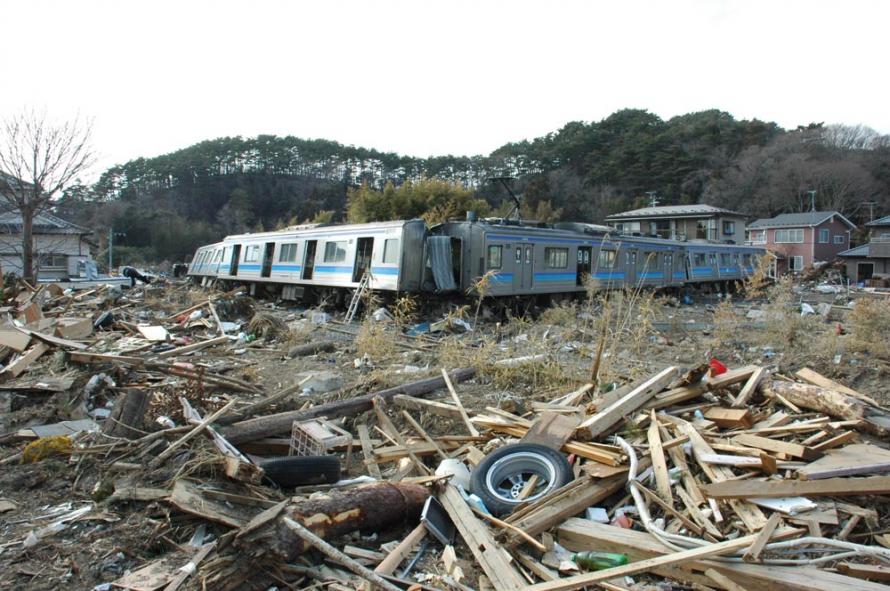
Higashi-Matsushima City: JR Senseki Line train swept off the rail line by the tsunami
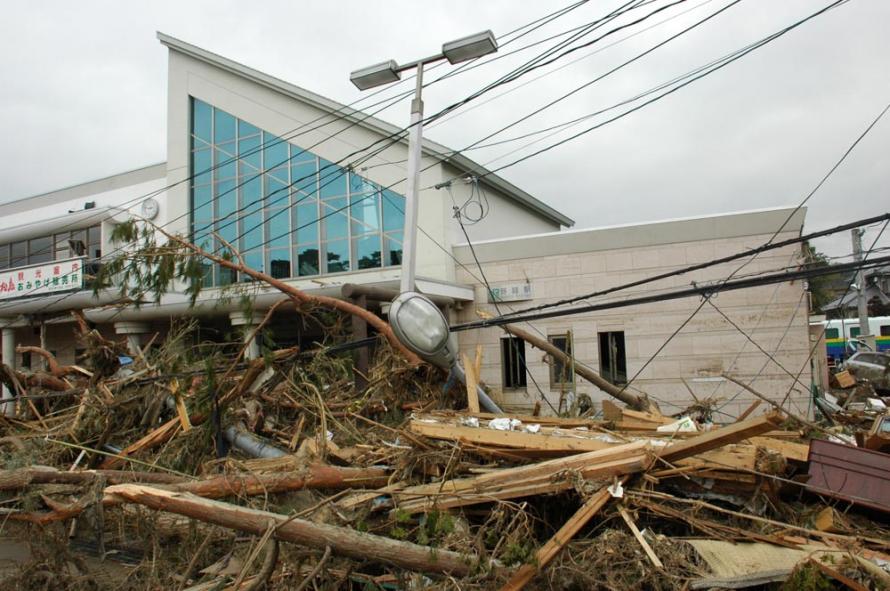
Higashi-Matsushima City: Former Nobiru Station
3. Sendai and Matsushima Areas
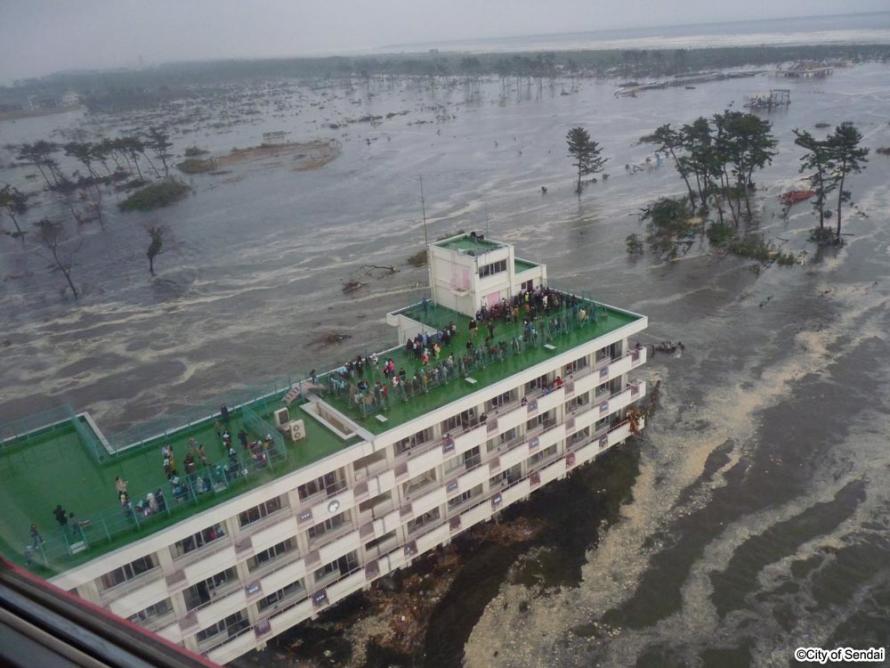
Sendai City: Arahama Elementary School stranded in the tsunami
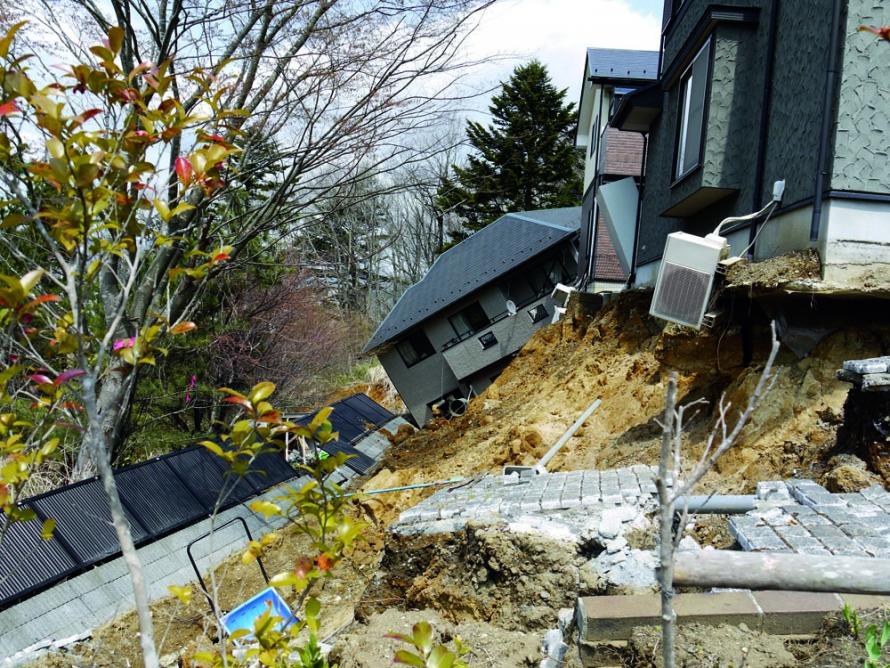
Sendai City: Damage to residential land in a hilly suburban area (Seikaen, Aoba Ward, Sendai)
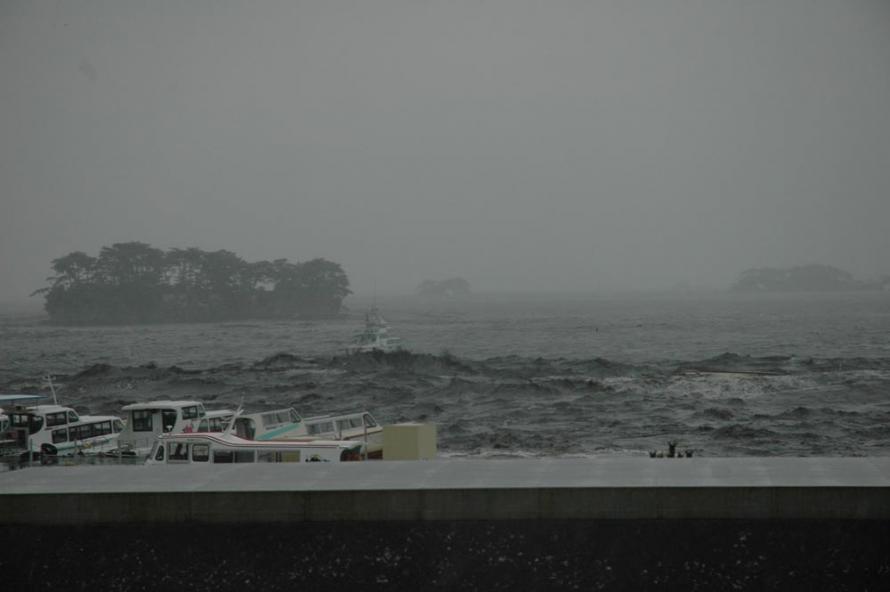
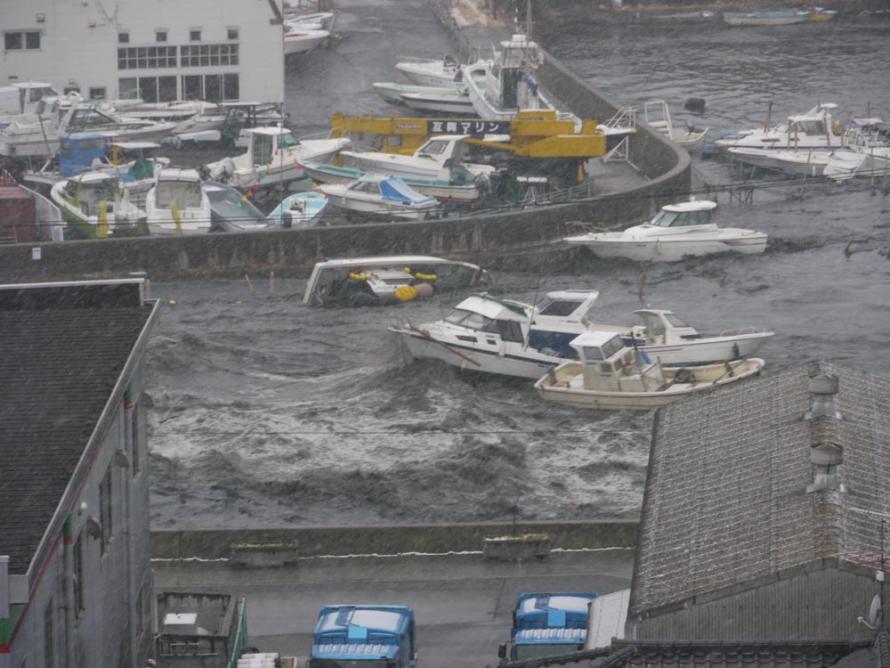
Matsushima Town: The tsunami reaches the coast
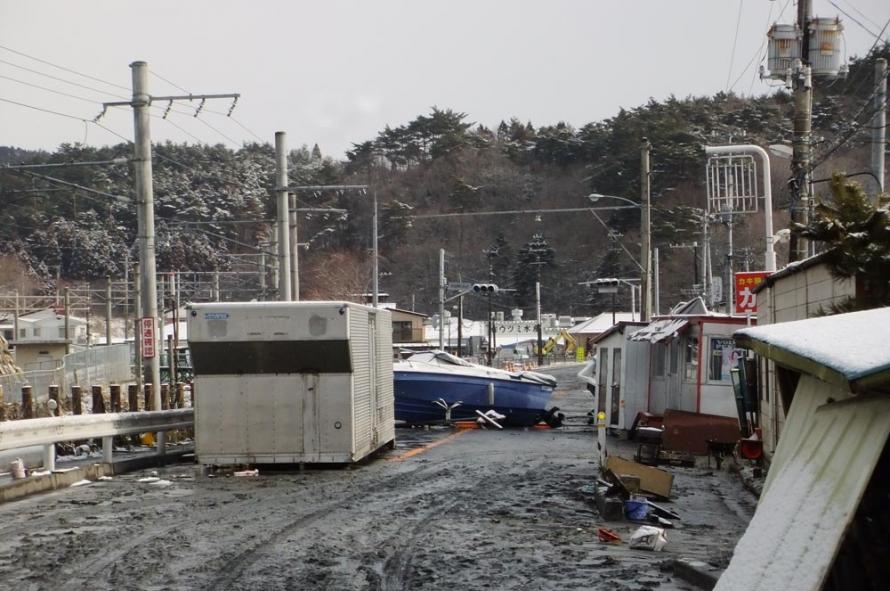
Rifu Town: A boat swept onto land by the tsunami
Shiogama City: Tsunami infiltrating the Teizan Canal (photo taken from the 2nd Regional Coast Guard Miyagi-Shiogama Port government office building)
Shichigahama Town: Shiomidai Minami (photo taken on April 7, 2011)
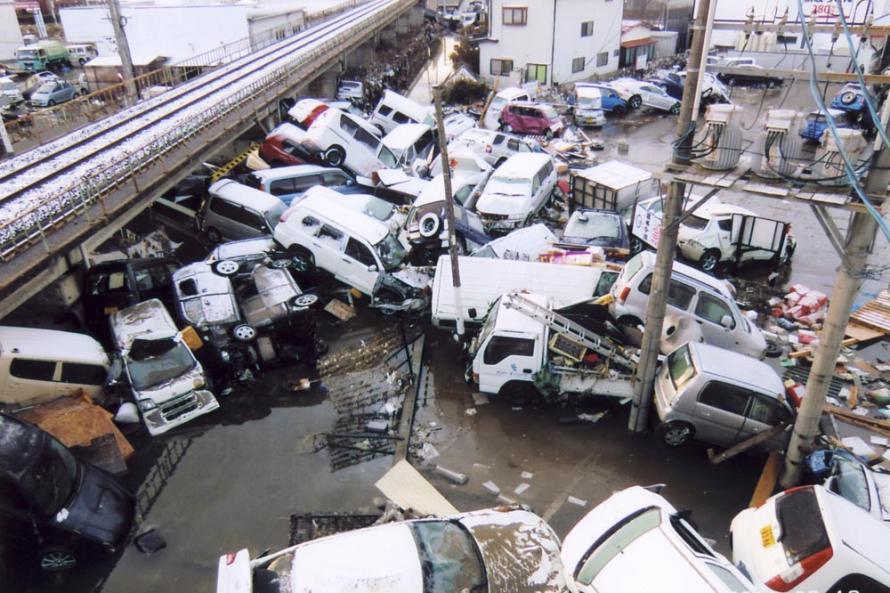
Tagajo City: Automobiles piled up by the tsunami
4. Southern Miyagi
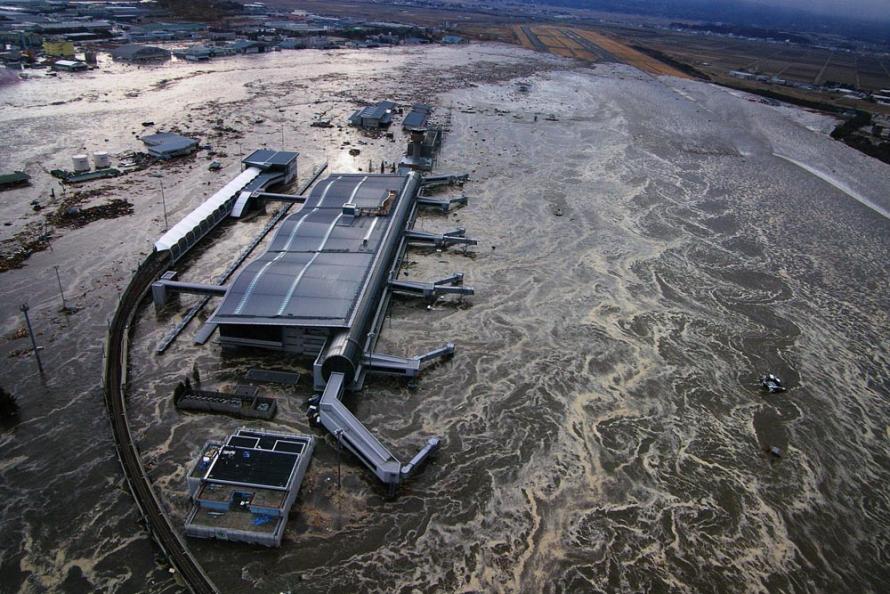
Natori City: Sendai Airport flooded by the tsunami
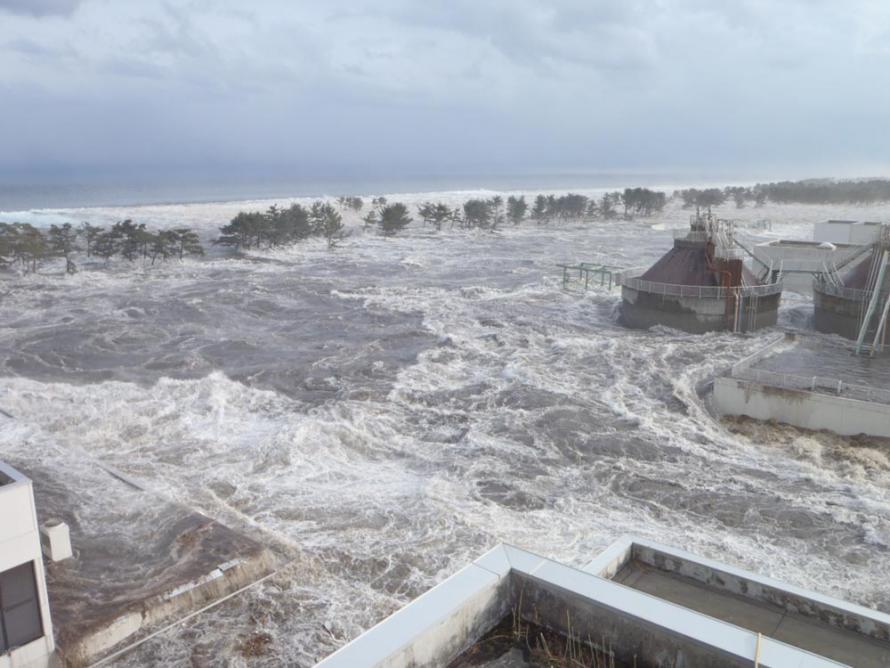
Iwanuma City: Tsunami striking Shimonogo (photo taken from the sewage treatment center for the southern part of the prefecture)
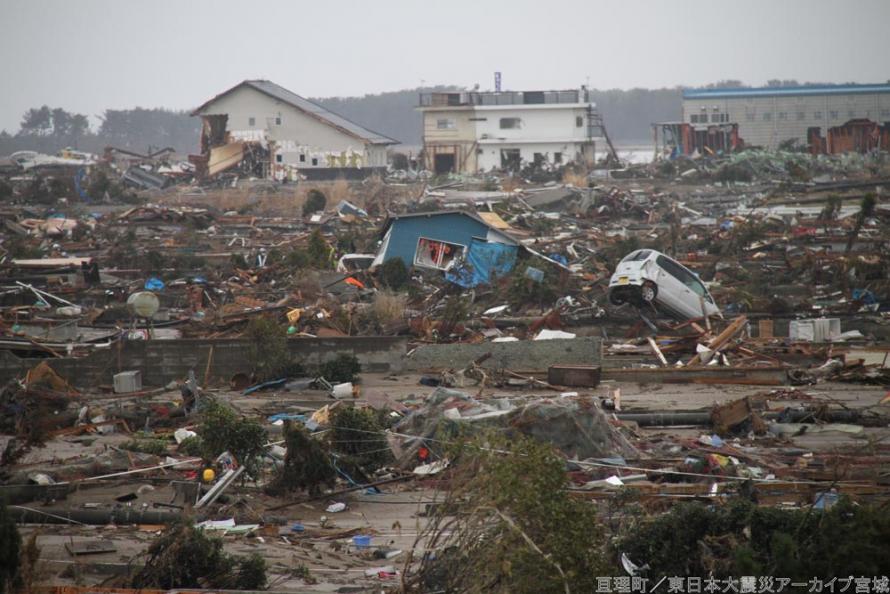
Watari Town: Arahama 5-chome district
Yamamoto Town: Nakahama Elementary School
5. Inland Areas
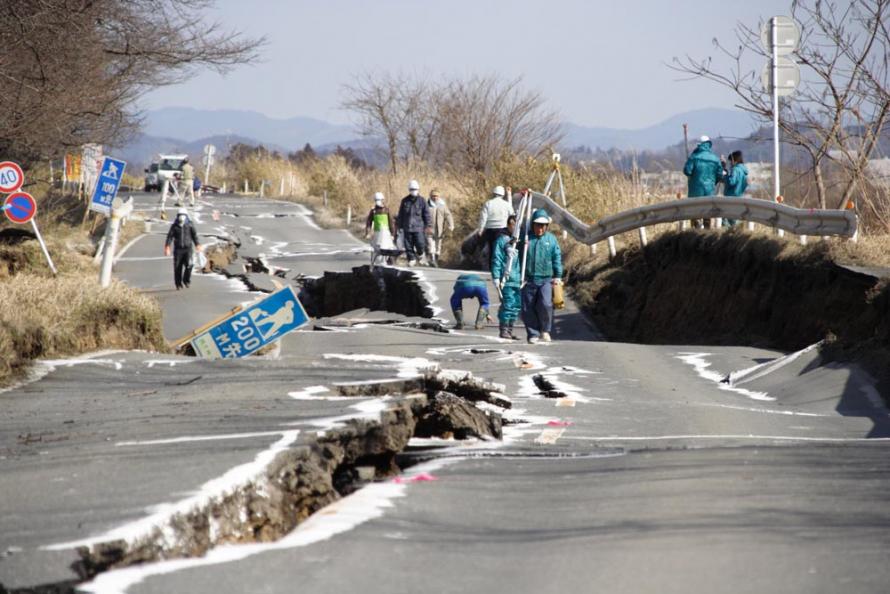
Kurihara City: Severe road damage (Wakayanagi, Ohayashi)
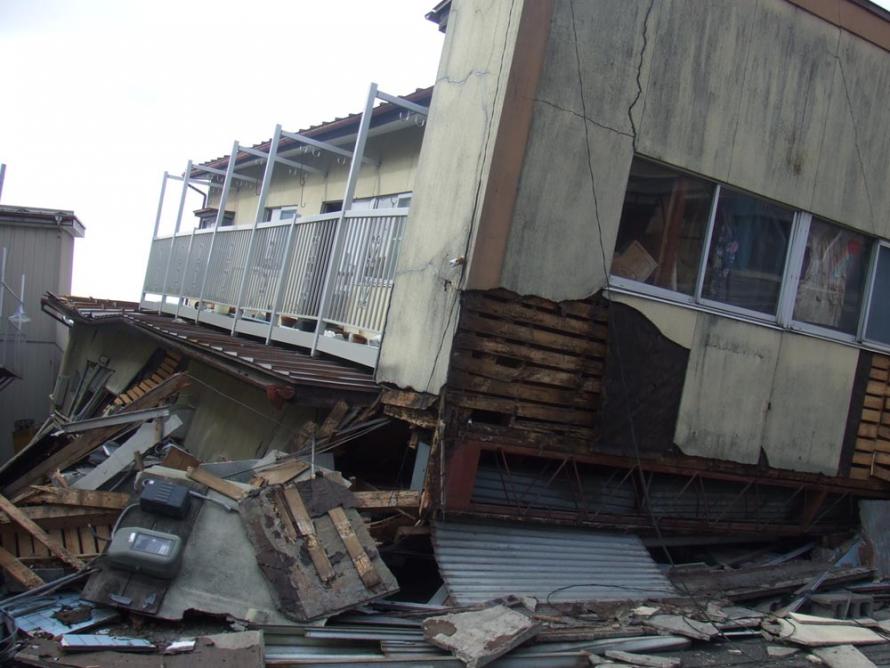
Tome City: Collapsed housing
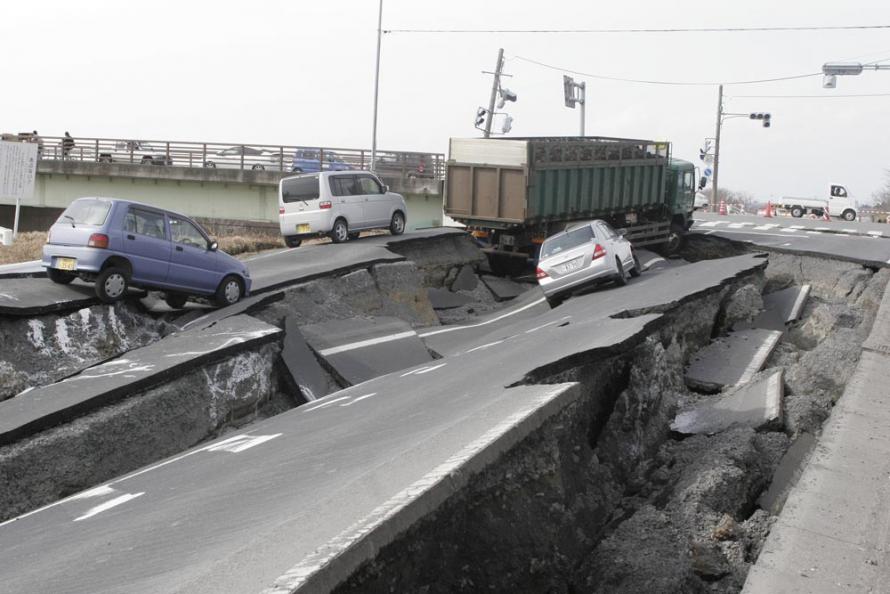
Osaki City: Devastated road near Furukawa Eai (photo taken on March 11, 2011)
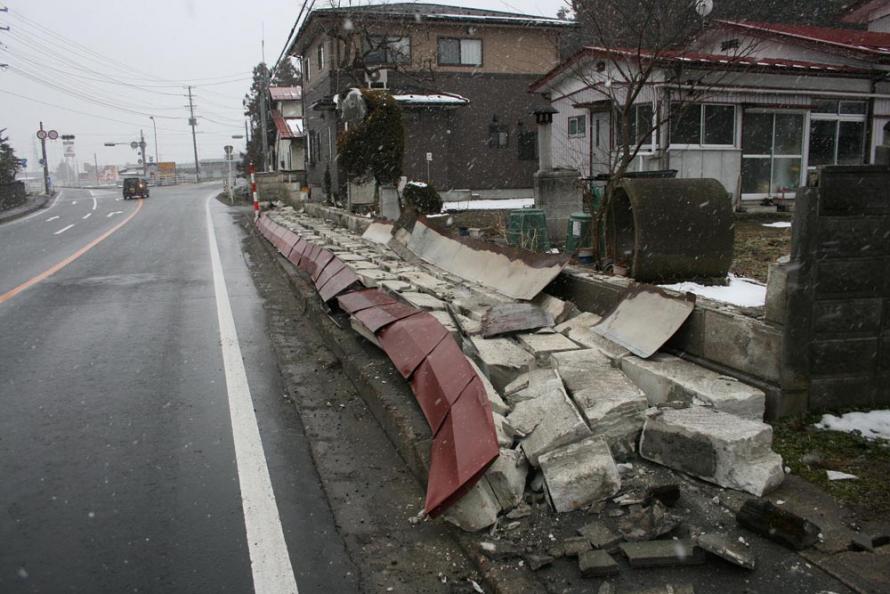
Kami Town: Collapsed block wall
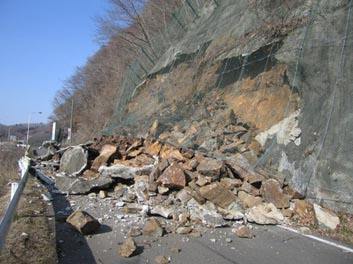
Kawasaki Town: Collapsed slope blocking road in Kamabusa, Hasekura
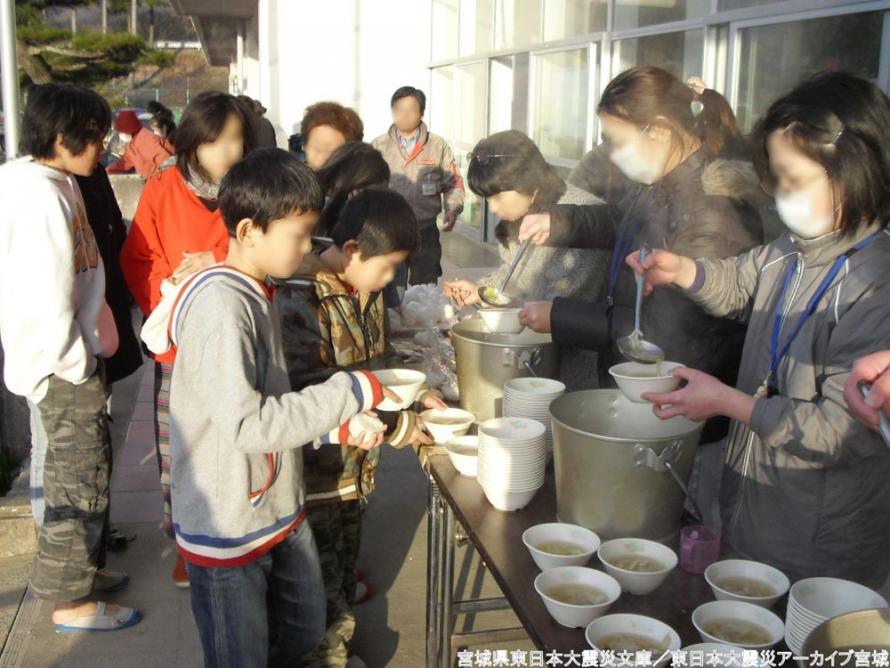
(3) Evacuation of Survivors
In addition to the tsunami damage in coastal areas of the prefecture, inland areas were also disrupted by earthquake and tsunami damage to electricity, gas, water and sewage systems. The day after the disaster, 559 evacuation centers were opened throughout the prefecture, with 102,058 evacuees. The number of evacuees in Miyagi peaked on March 14 at 320,885 people, and the number of evacuation centers peaked on March 15 at 1,323.
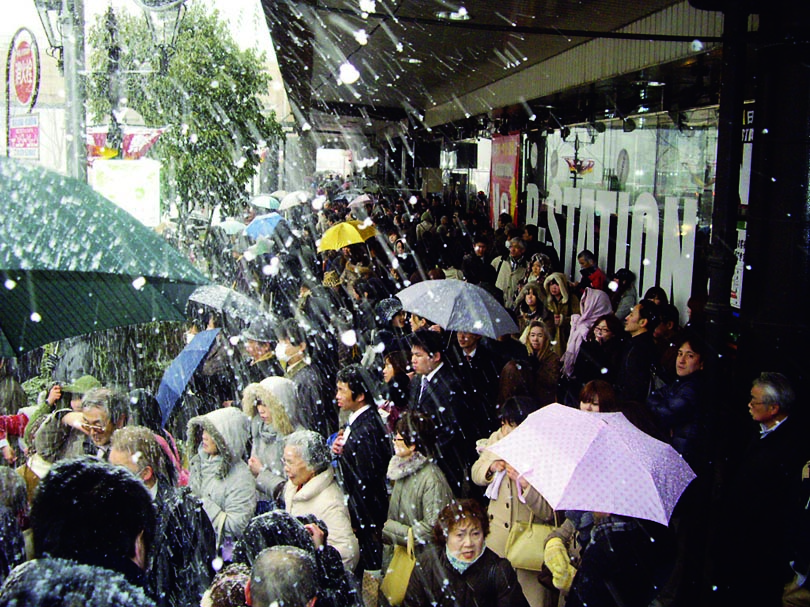
Bus stop in front of JR Sendai Station immediately after the earthquake
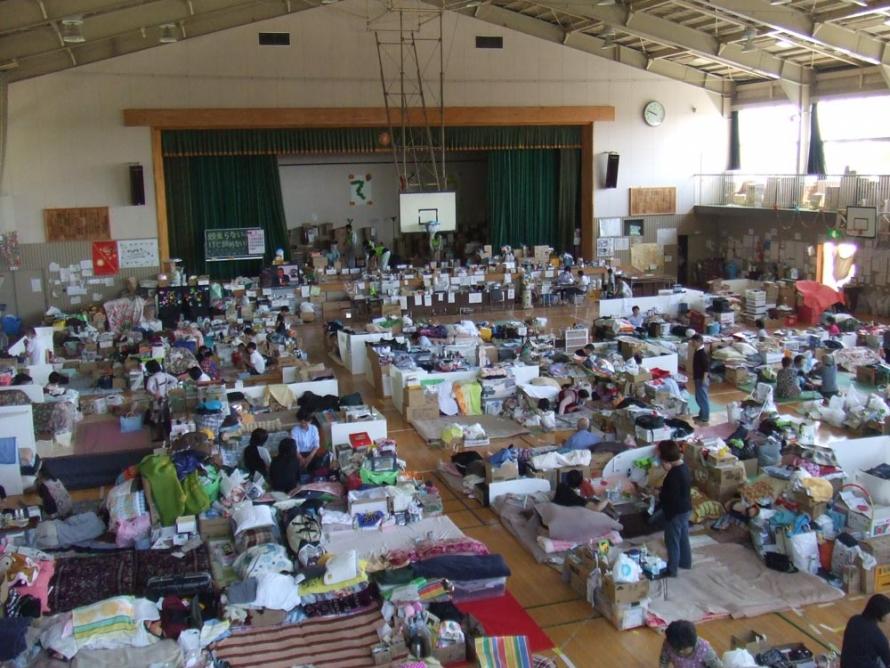
Evacuation center (Natori City)
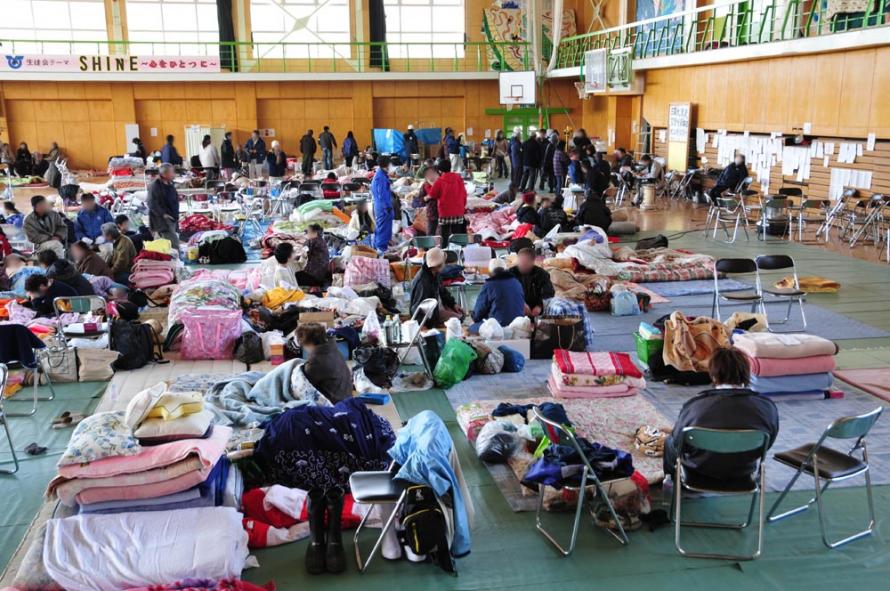
Evacuation center (Ishinomaki City)
Yamashita Daiichi Elementary School becomes an evacuation center (Yamamoto Town)
Meal preparation by evacuees (Ishinomaki City)
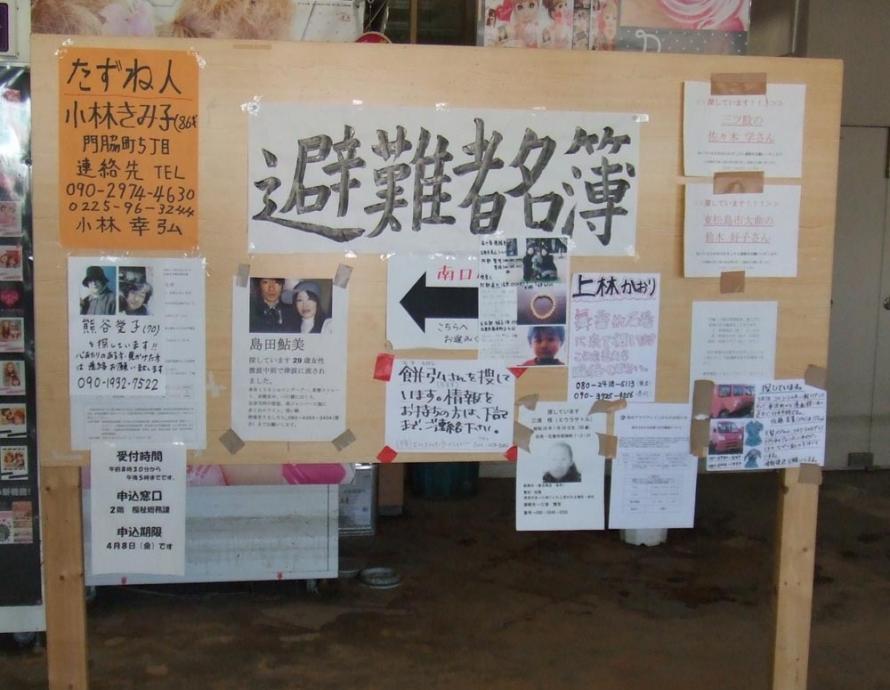
Handwritten memos posted at an evacuation center seeking individuals and a confirmation of their safety
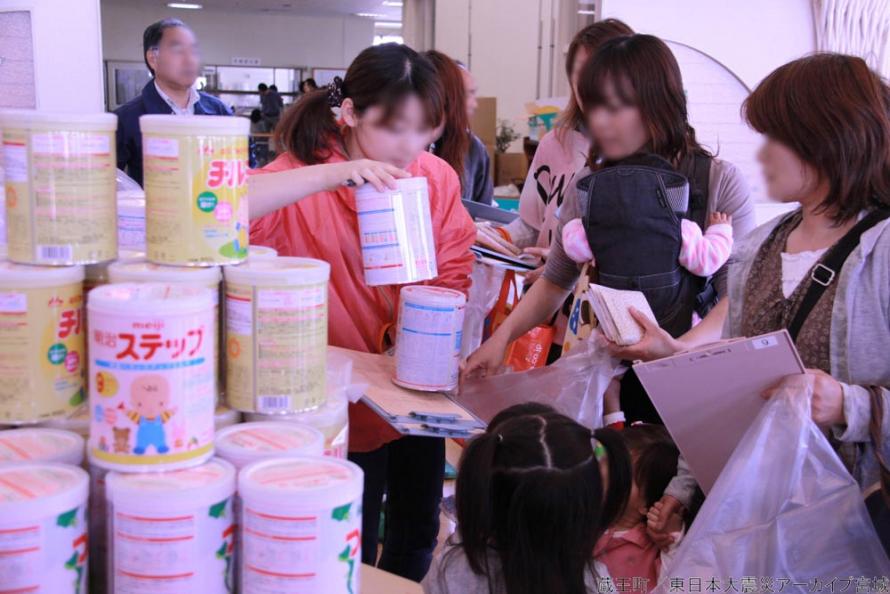
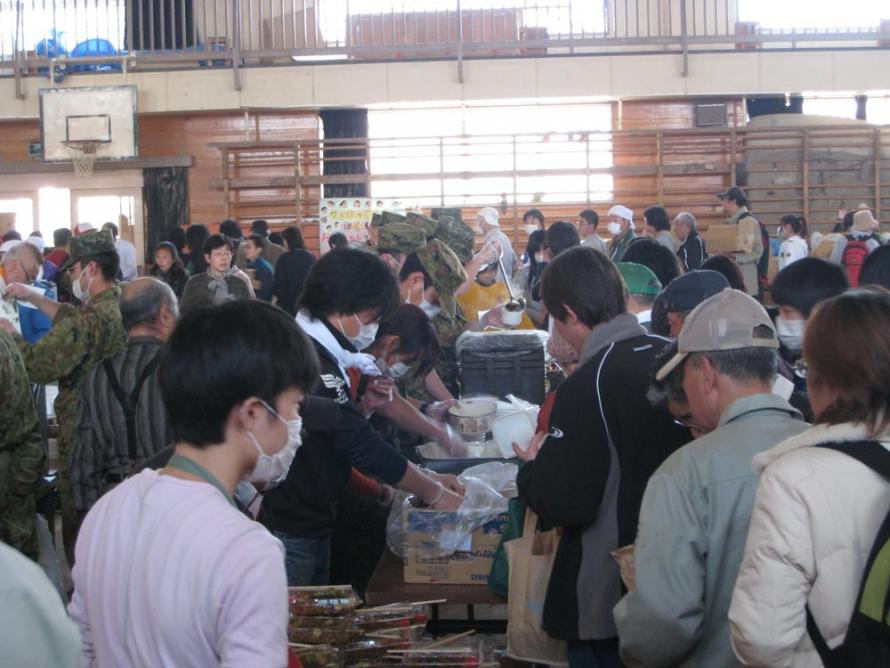
Distribution of relief supplies (Zao Town)
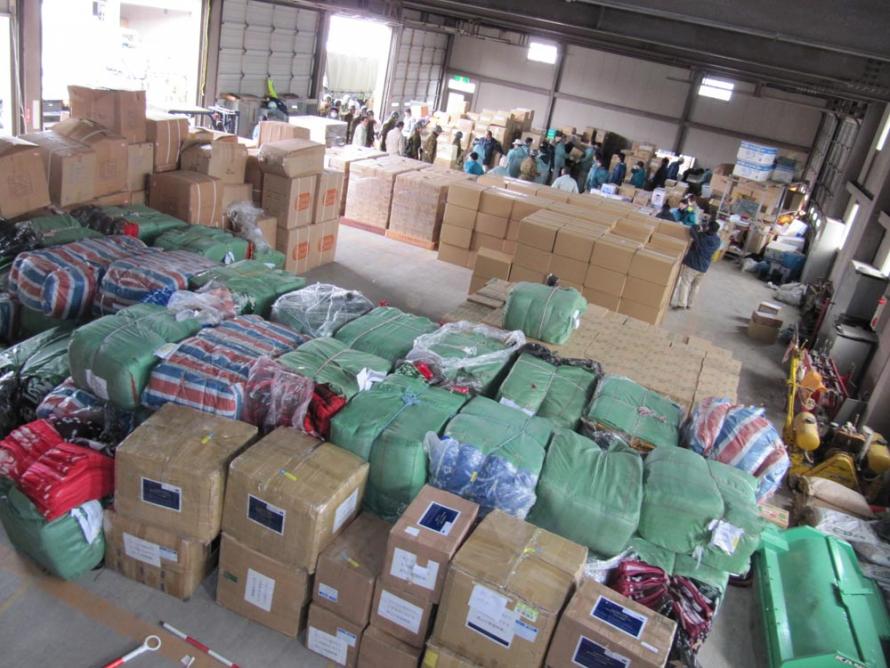
Relief supplies received (prefectural government building)
(4) Support from around the World
Although many precious lives were lost in the Great East Japan Earthquake and people’s hometowns were devastated, warm support came in from all over the world. Support was received from both governments and private citizens, including from the Japanese government, Self-Defense Forces, Japan Coast Guard, police and fire departments, medical institutions, local governments across Japan, and individual volunteers.
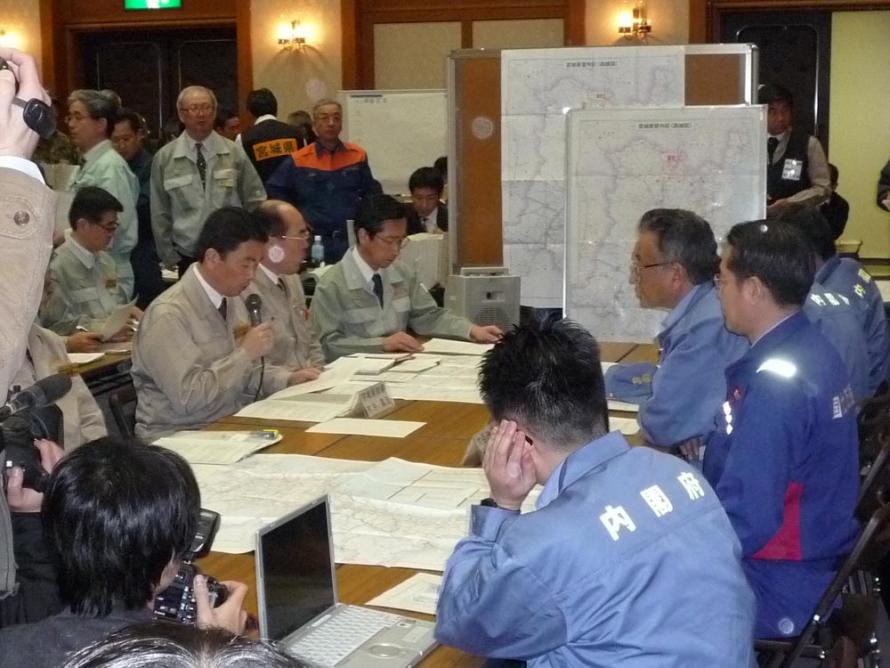
The governor giving information about the situation to a government survey team

Self-Defense Forces rescuing a person
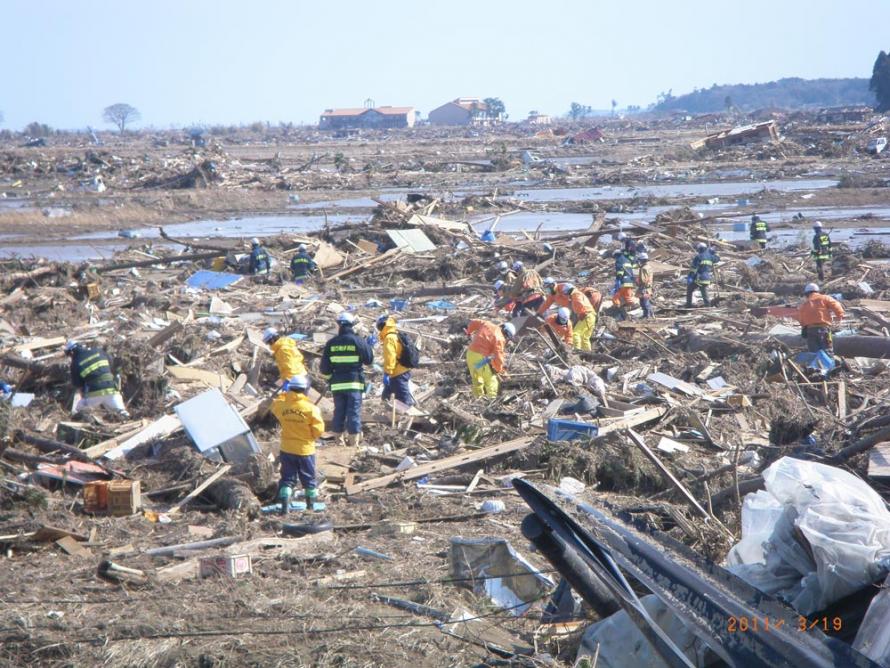
Search by emergency firefighting rescue teams (Watari District Fire Department)
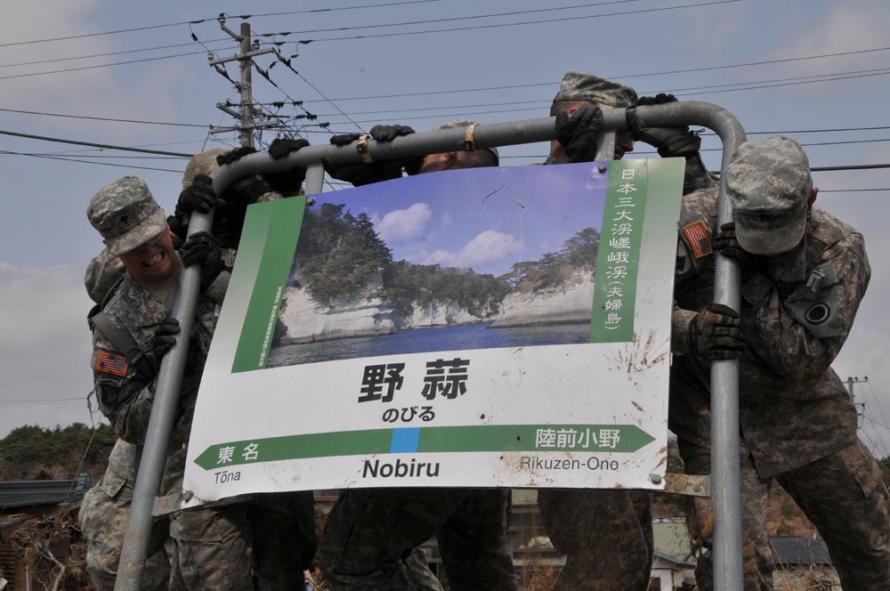
The U.S. military carrying out Operation Tomodachi
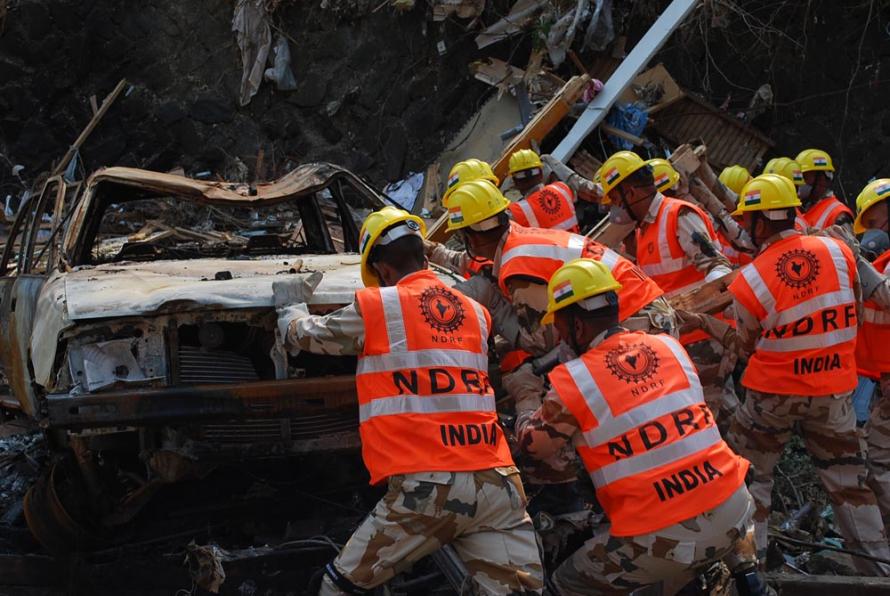
India’s National Disaster Response Force in action
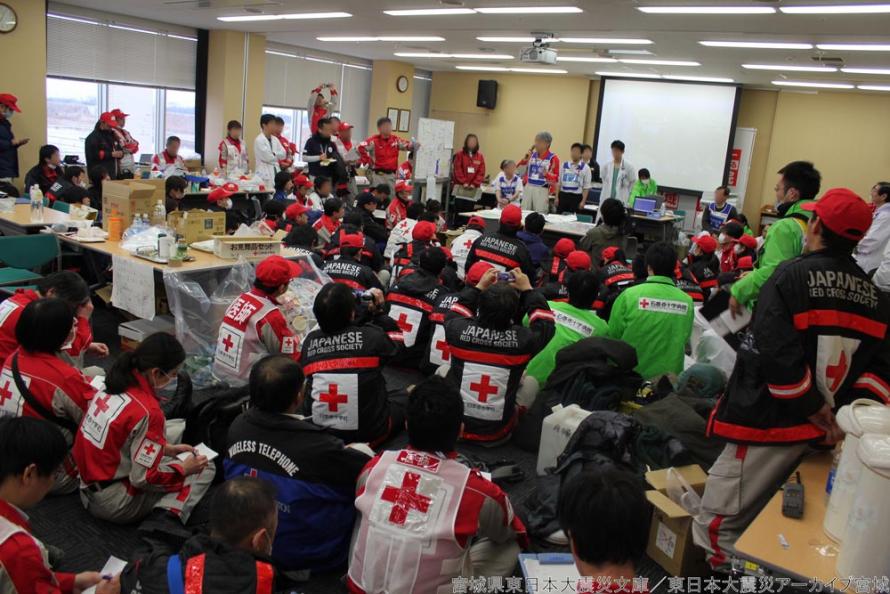
Rescue team meeting at Ishinomaki Red Cross Hospital
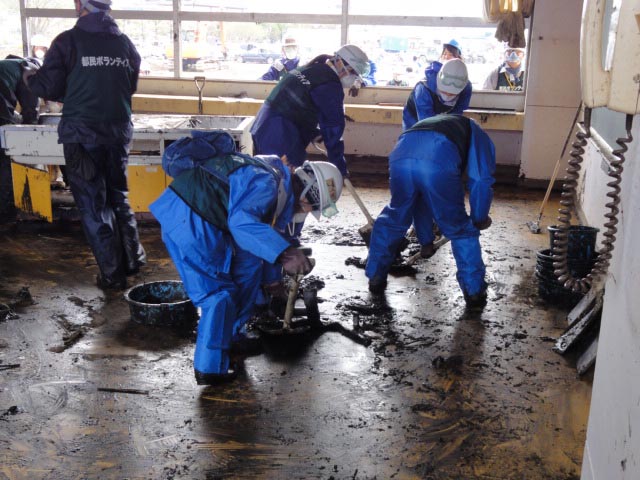
Volunteers in action
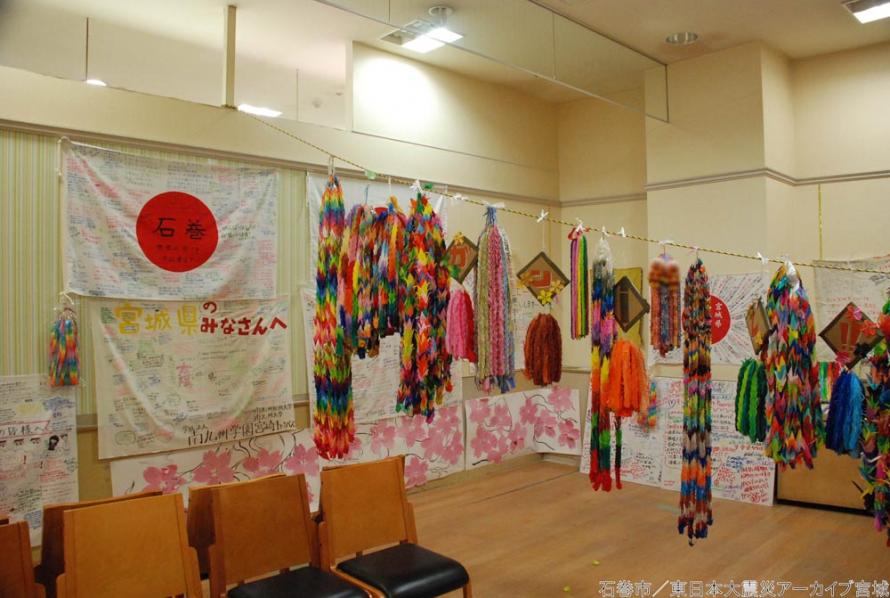
Warm messages of support and strings of a thousand paper cranes